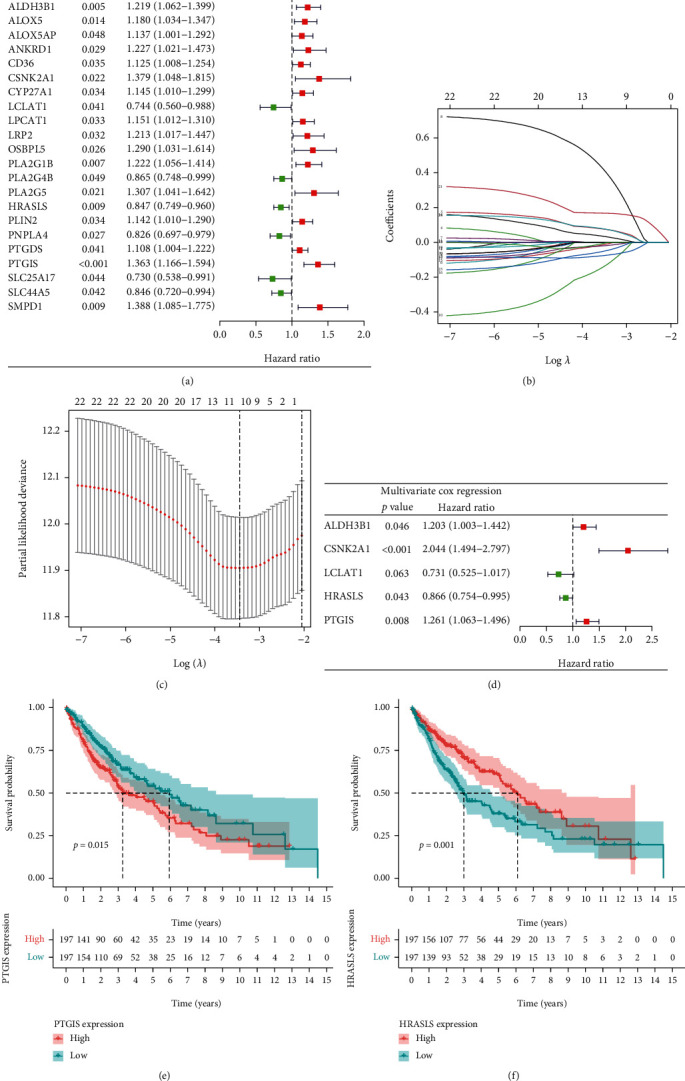
Figure 4.

Identification of independent prognostic genes for LUSC. (a) Forest map of differentially expressed LMRGs related to LUSC survival, analyzed by the univariate Cox regression. (b) LASSO coefficient spectrum of 25 genes in LUSC. Generate a coefficient distribution map for a logarithmic (λ) sequence. (c) Selecting the best parameters for LUSC in the LASSO model (λ). (d) Forest map of independent prognostic genes in LUSC, analyzed by the multivariate Cox regression. (e) The Kaplan-Meier survival curve of PTGIS. (f) The Kaplan-Meier survival curve of HRASLS.
