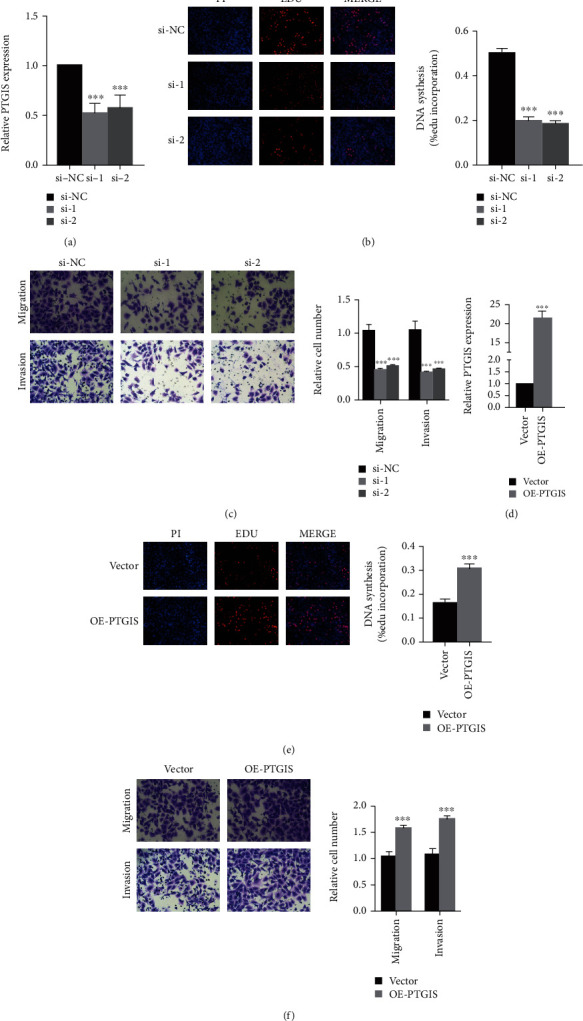
Figure 6.

PTGIS promotes LUSC proliferation, migration, and invasion. (a) The mRNA expression of PTGIS in the SK-MES-1 cell line transfected with siRNAs or si-NC was measured by qRT-PCR. (d) The overexpression plasmid of PTGIS or the control vector was transfected into the SK-MES-1 cell line, and the mRNA expression of PTGIS was measured by qRT-PCR. (b, e) Representative images of EdU assay after PTGIS knockdown (b) and PTGIS overexpression (e) in SK-MES-1 cells. (c, f) Representative images of transwell assay after PTGIS knockdown (c) and PTGIS overexpression (f) in SK-MES-1 cells. ∗∗∗p < 0.001.
