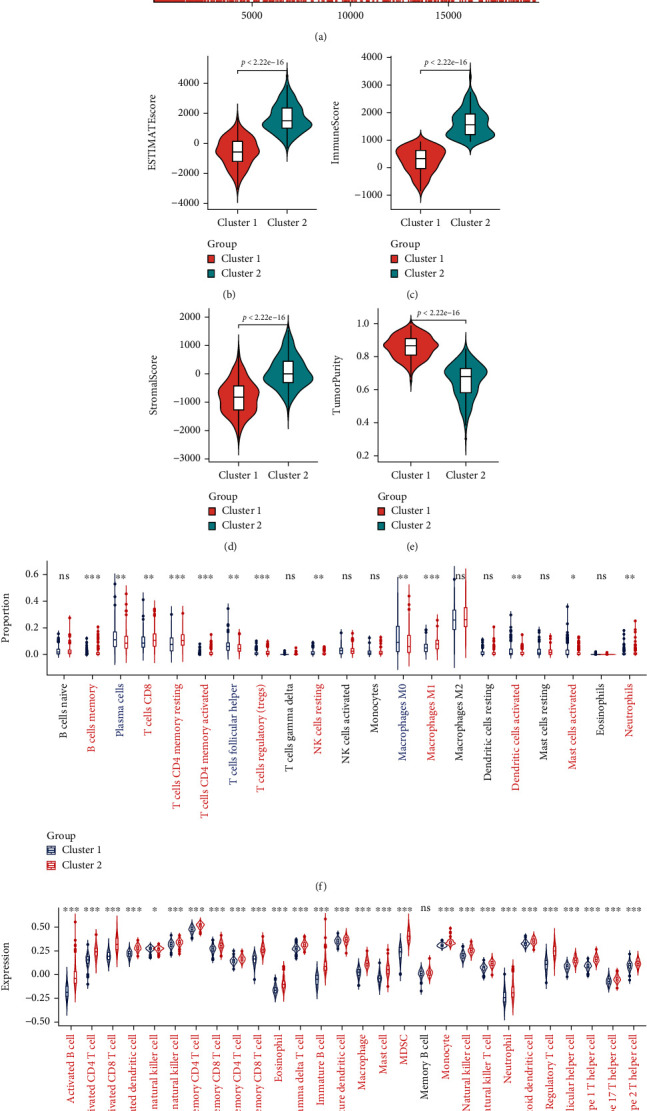
Figure 9.

Comparison of immune characteristics between two clusters. (a) Gene set enrichment analysis (GSEA) between two clusters. Comparison of ESTIMATEScore (b), ImmuneScore (c), StromalScore (d), TumorPurity (e), the proportion of 22 immune cells (f), and expression of 28 immune cells (g) between two clusters. ns: no significance. ∗p < 0.05, ∗∗p < 0.01, and ∗∗∗p < 0.001.
