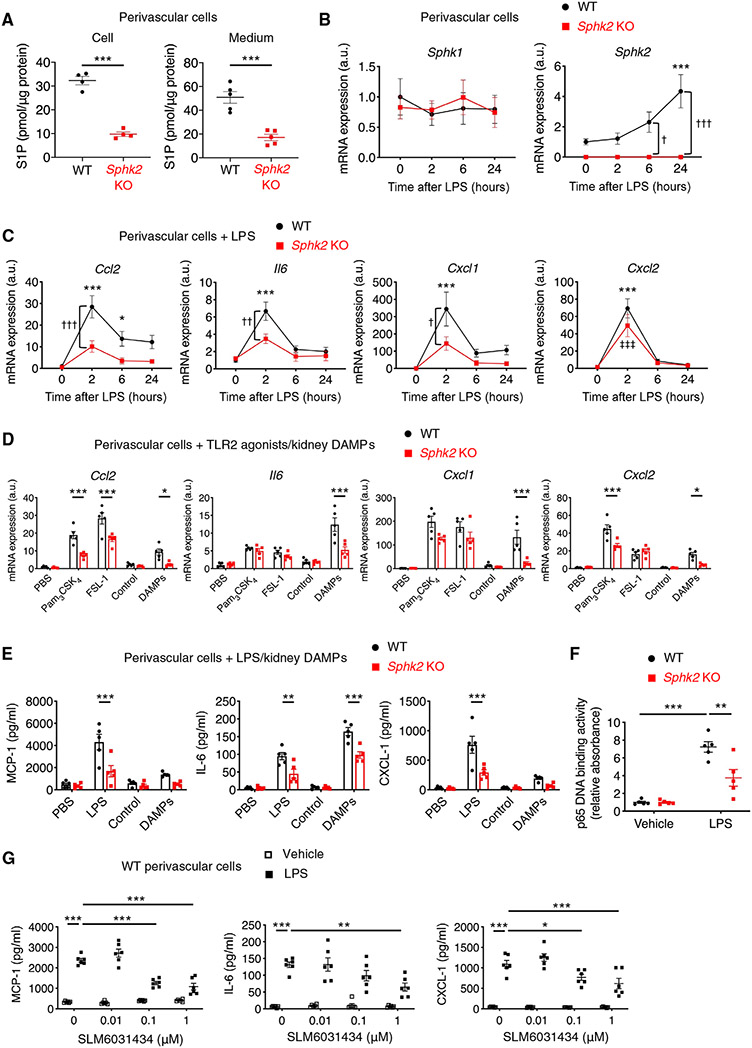
Fig. 3. SphK2 inhibition suppresses inflammatory signaling in mouse perivascular cells.
(A to G) Experiments were performed using primary kidney perivascular cells isolated from Sphk2PVCWT (WT) and Sphk2PVCKO [Sphk2 knockout (KO)] mice. (A) S1P concentrations in perivascular cells and in media. (B and C) Time course of transcript expression of Sphk1/Sphk2 (B) and proinflammatory cytokines and chemokines (Ccl2, Il6, Cxcl1, and Cxcl2) after LPS treatment. (D) Transcript expression of Ccl2, Il6, Cxcl1, and Cxcl2 at 2 hours after treatment with TLR2 agonists (Pam3CSK4 and FSL-1) or kidney DAMPs. (E) MCP-1, IL-6, and CXCL-1 concentrations in supernatants of kidney perivascular cells treated with LPS or kidney DAMPs for 24 hours. (F) NF-κB activity at 1 hour after treatment with LPS. (G) Dose response of a selective SphK2 inhibitor (SLM6031434) on MCP-1, IL-6, and CXCL-1 concentrations in supernatants of wild-type kidney perivascular cells at 24 hours after LPS treatment. n = 4 to 5 (A), n = 5 (B to F), or n = 6 (G) per group. Data are represented as means ± SEM. *P < 0.05, **P < 0.01, and ***P < 0.001 by unpaired two-sided Student’s t test (A) or two-way ANOVA followed by post hoc multiple comparisons test (Tukey’s) (D to G). *P < 0.05 and ***P < 0.001 (versus WT at 0 hours); †P < 0.05, ††P < 0.01, and †††P < 0.001 (WT versus Sphk2 KO at the same time point); ‡‡‡P < 0.001 (versus Sphk2 KO at 0 hours) by two-way ANOVA followed by post hoc multiple comparisons test (Tukey’s) (B and C).

