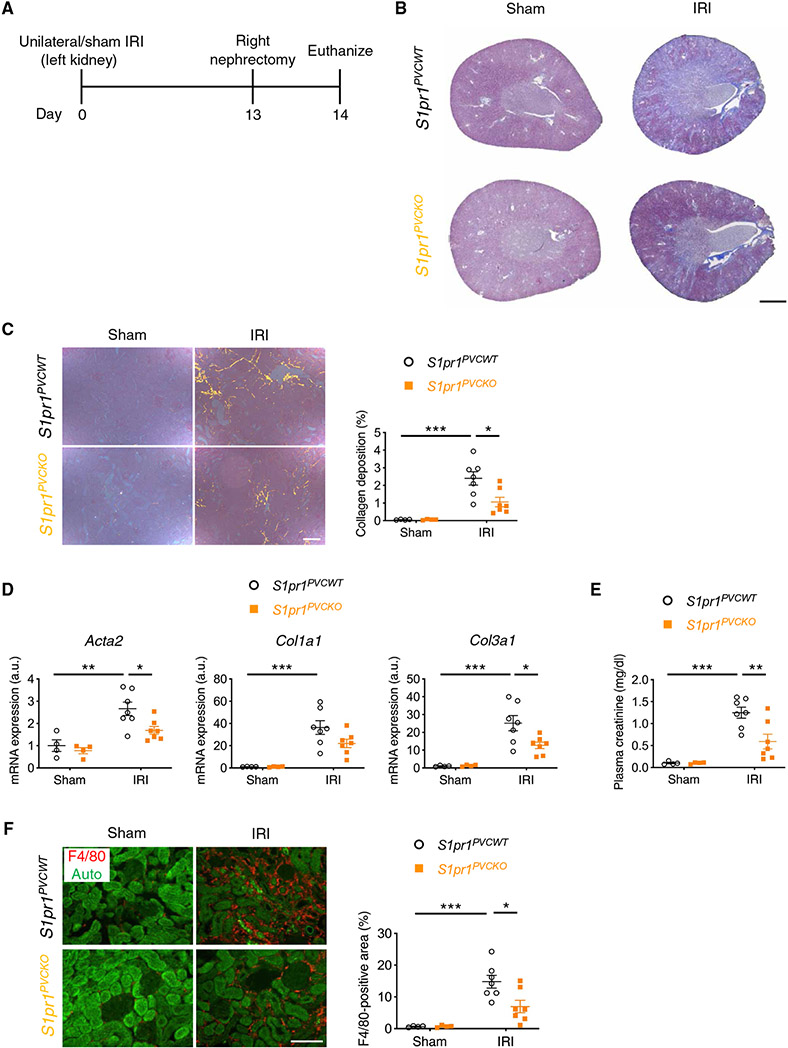
Fig. 5. S1pr1 deletion in renal perivascular cells ameliorates kidney fibrosis in the unilateral IRI mouse model.
(A) Protocol for unilateral IRI to induce kidney fibrosis in mice (for B to F). S1pr1PVCKO (Foxd1-Cre;S1pr1fl/fl) mice, in which S1pr1 is deleted in kidney perivascular cells, and Cre-negative littermate control (S1pr1PVCWT) mice underwent left renal pedicle clamp for 30 min (day 0) and right nephrectomy at day 13 and were euthanized at day 14. (B) Representative Masson’s trichrome staining of collagen in kidney sections at day 14. (C) Picrosirius red staining of kidney (polarized microscopy, left) with quantification of red/yellow birefringence of mature collagen fibers as a percentage of the total surface area of kidney section at day 14 (right). (D) Acta2, Col1a1, and Col3a1 transcript expression (from whole kidney) at day 14. (E) Plasma creatinine concentrations at day 14. (F) Macrophage staining (F4/80, red, left) of kidney with quantification of F4/80-positive area as a percentage of the total surface area of kidney section at day 14 (right). Auto, autofluorescence (green). Scale bars, 1 mm (B), 200 μm (C), and 100 μm (F). n = 4 to 7 per group. Data are represented as means ± SEM. *P < 0.05, **P < 0.01, and ***P<0.001; two-way ANOVA followed by post hoc multiple comparisons test (Tukey’s).

