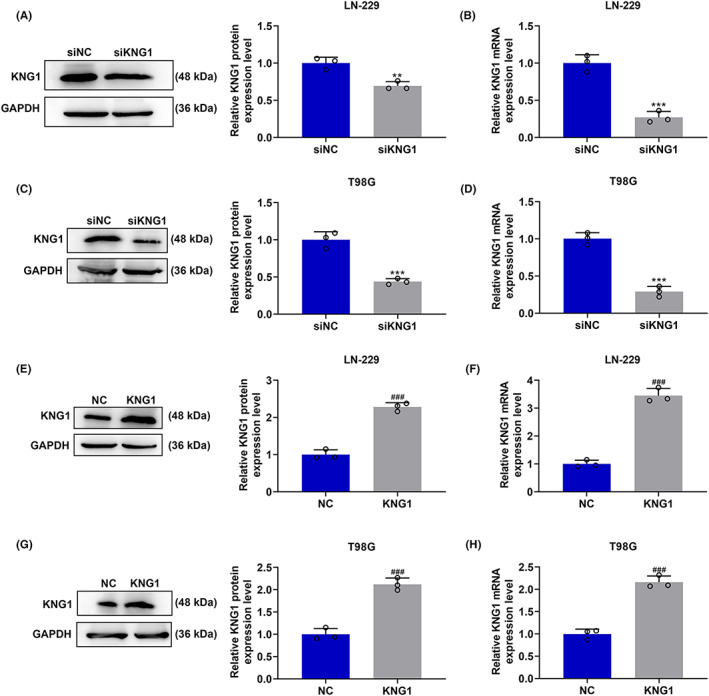
FIGURE 2.

The transfection efficiency of siKNG1 and KNG1 overexpression plasmids in LN‐229 and T98G cells. (A–H) The expression level of KNG1 in LN‐229 and T98G cells after transfection was detected by RT‐qPCR and Western blot. GAPDH was used as an internal control. (***p < 0.001 vs. siNC; ### p < 0.001 vs. NC). All experiments were conducted three times. (NC: negative control)
