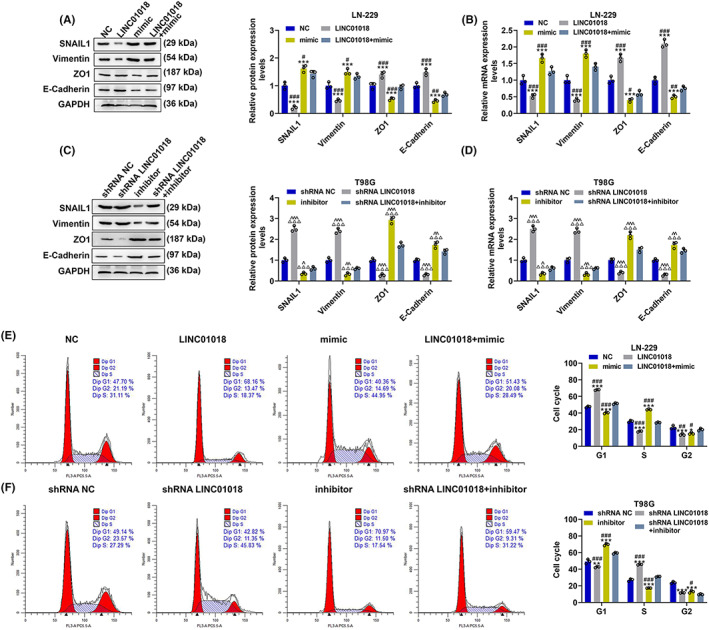
FIGURE 9.

LINC01018 overexpression and knockdown diminished the effects of miR‐942‐5p mimic and inhibitor on cell cycle distribution and related gene expressions in LN‐229 and T98G cells, respectively. (A–D) The expressions of SNAIL1, Vimentin, ZO1, and E‐Cadherin in LN‐229 and T98G cells after transfection were quantified by Western blot and RT‐qPCR, with GAPDH serving as an internal control. (E, F) The cell cycle distribution of LN‐229 and T98G cells after transfection were detected by flow cytometry (*p < 0.05, **p < 0.01, ***p < 0.001 vs. NC; # p < 0.05, ## p < 0.01, ### p < 0.001 vs. LINC01018 + mimic; △ p < 0.05, △△△ p < 0.001 vs. shRNA NC; ^ p < 0.05, ^^ p < 0.01, ^^^ p < 0.001 vs. shRNA LINC01018 + inhibitor) (NC: negative control)
