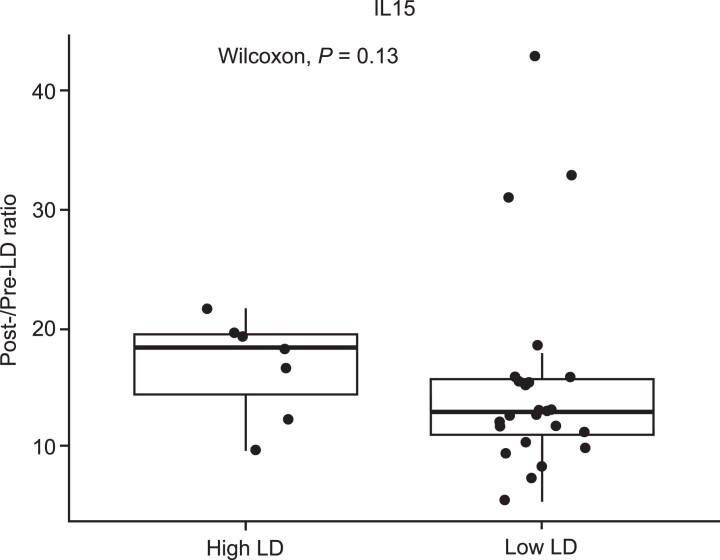
Extended Data Fig. 9. Post-/pre-lymphodepleting chemotherapy serum IL-15 ratio in patients treated with high dose (3600 mg/m2) or low dose (1800 mg/m2) lymphodepleting chemotherapy.
Serum IL-15 concentration increased in post-LD versus pre-LD samples, and there was no difference in IL-15 concentrations between the two LD regimens in patients treated in Group 3/Expansion (median of ‘high’ LD 18.25 (n = 7), median of ‘low’ LD 12.87 (n = 24); P = 0.13, Two-sided Wilcoxon test). Box plots depict median as horizontal lines within boxes, with box bounds as the first and third quartiles. Dots represent individual data points. Lower whisker is the minimum value of the data within 1.5 times the interquartile range below the 25th percentile. Upper whisker is the maximum value of the data within 1.5 times the interquartile range above the 75th percentile. IL, interleukin; LD, lymphodepletion.

