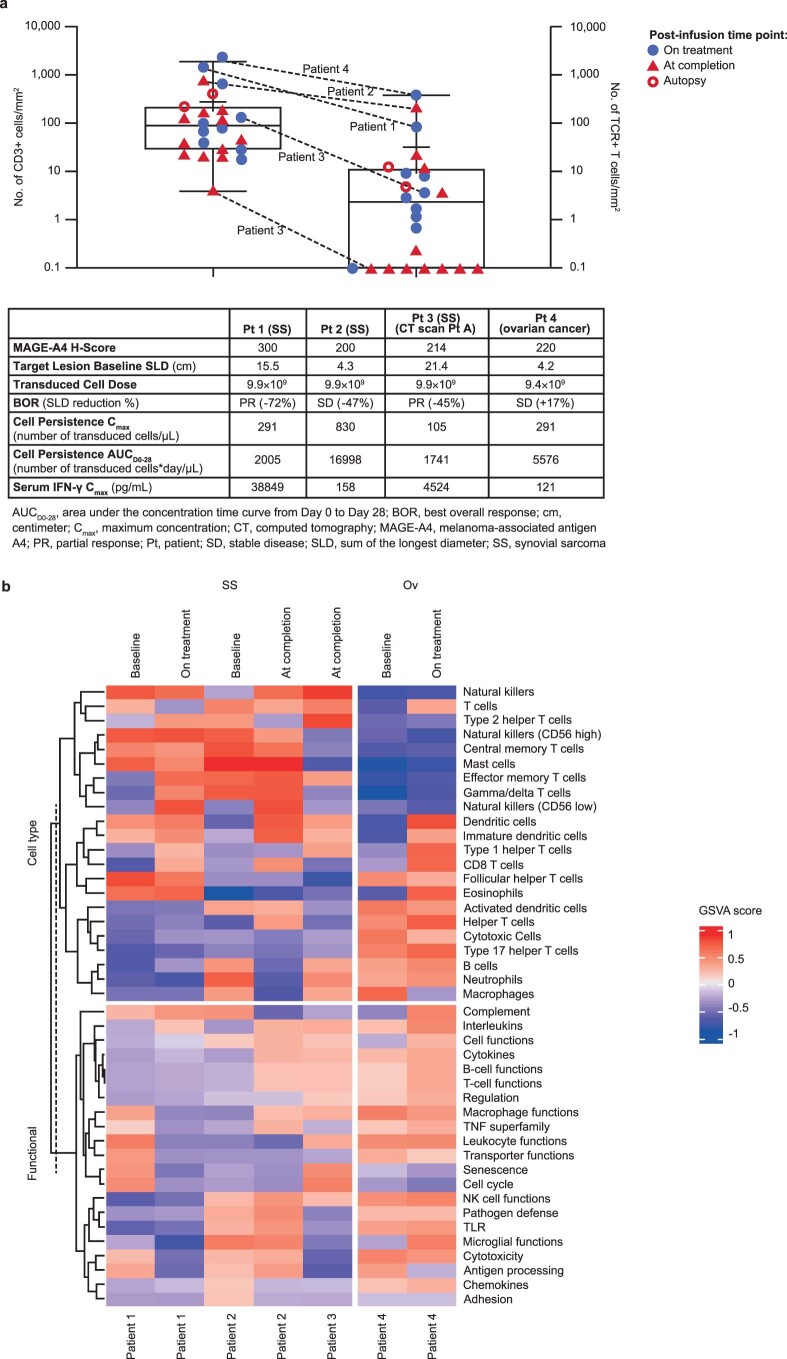
Extended Data Fig. 10. Detection of afami-cel and characterization of phenotypes in patient tumor biopsies.
(a) Quantification of CD3+ T cells and afami-cel in post-infusion tumor biopsies from dose expansion: Four patients with contrasting profiles were prioritized for multiplex immunofluorescence analyses (summarized in Fig. 4a). Patient 1, SS, on-treatment biopsy taken 8 weeks post-infusion; Patient 2, SS, at completion biopsy taken 17 weeks post-infusion; Patient 3, SS, on-treatment and at-completion biopsies taken 7 and 25 weeks post-infusion, respectively; Patient 4, Ov tumor, on-treatment biopsy taken 6 weeks post-infusion. Table summarizes key baseline tumor characteristics, afami-cel dose, post-infusion pharmacokinetic-pharmacodynamic findings, and BOR status for these four patients. Patients 1-3 were patients with SS; Patient 4 was a patient with Ov cancer. Box plots depict median as horizontal lines within boxes, with box bounds as the first and third quartiles. Dots represent individual data points. Lower whisker is the minimum value of the data within 1.5 times the interquartile range below the 25th percentile. Upper whisker is the maximum value of the data within 1.5 times the interquartile range above the 75th percentile. (b) Heatmap of GSVA scores of cell type specific and immune response categories gene lists in baseline and post-infusion biopsies from Patients 1‒4. AUC, area under the curve; BOR, best overall response; Cmax, maximum serum concentration; CT, computed tomography; GSVA, gene set variation analysis; IFN, interferon; MAGE-A4, melanoma-associated antigen A4; NK, natural killer; Ov, ovarian; PR, partial response; Pt, patient; SD, stable disease; SLD, sum of longest diameter; SS, synovial sarcoma; TCR, T-cell receptor; TLR, toll-like receptor; TNF, tumor necrosis factor.

