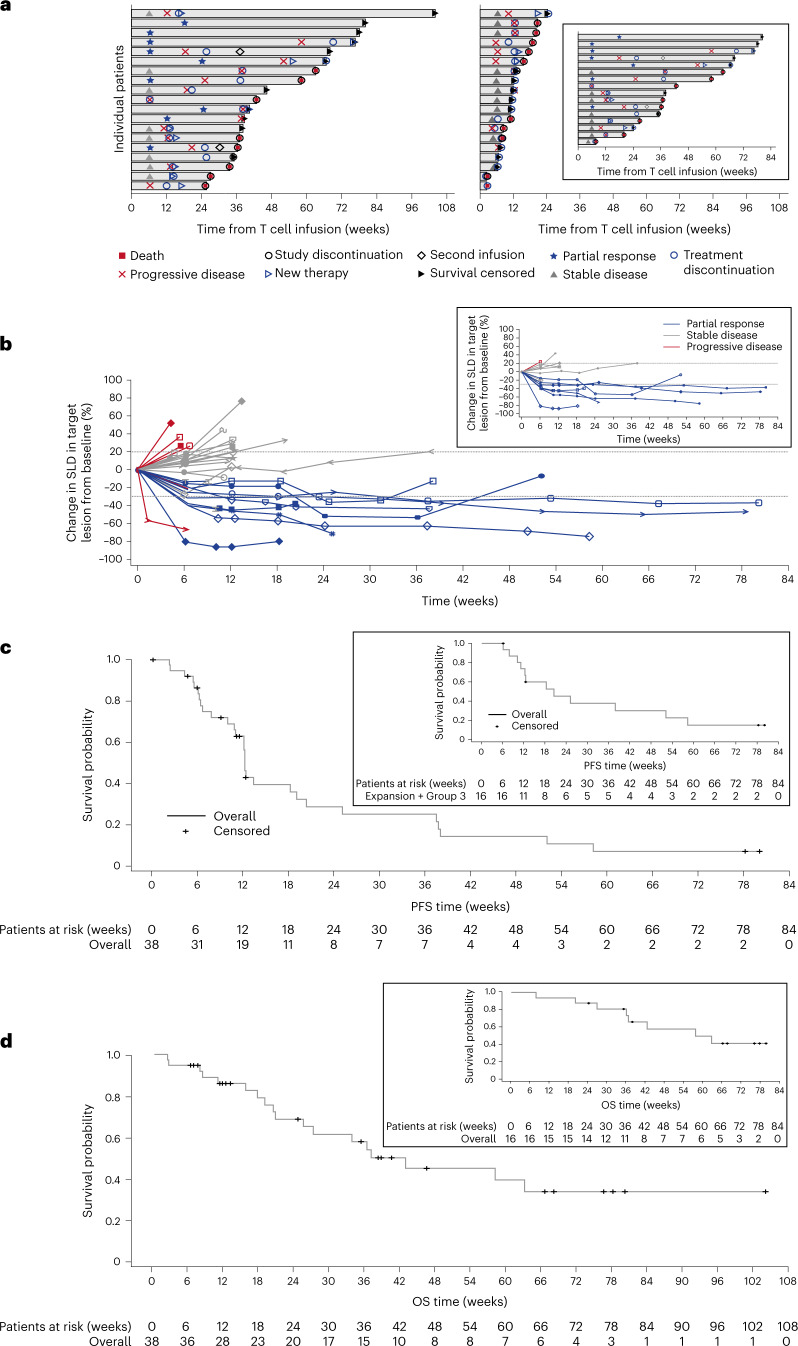
Fig. 2. Response and prognostic characteristics of the mITT population and patients with SS.
a, Swimmer’s plot of patient response over time in the mITT population (N = 38). The inset is response over time in patients with SS (n = 16). b, DoR profiles show the change from baseline in target lesions using RECIST version 1.1 in the overall treatment group after first infusion for responders and non-responders. The inset shows the change from baseline in target lesions in patients with SS. The probability of DoR was 100% (95% CI: 100, 100) at ≥12 weeks and 60% (95% CI: 20.4, 80.5) at ≥24 weeks. Duration of stable disease probability at ≥24 weeks for patients with SS was 50% (95% CI: 22.5%, 75.0%). c, Kaplan–Meier curves show PFS in the mITT population. The inset shows the PFS curve for the patients with SS. The median PFS for the mITT population was 12.3 weeks (95% CI: 10.9, 19.1) and 20.4 weeks (95% CI: 10.0, 52.1) for the patients with SS. PFS events in the mITT population included 25 events (65.8%) of PD and four events (10.5%) of death. PFS probability was 60% (95% CI: 44.8, 76.6) at 12 weeks and 30% (95% CI: 14.1, 45.2) at 24 weeks. PFS probability in the patients with SS was 70% (95% CI: 0.44, 0.89) at 12 weeks and 50% (95% CI: 0.19, 0.68) at 24 weeks. d, Kaplan–Meier curves show OS in the mITT population. The inset shows the OS for patients with SS. The median OS for the mITT population was 42.9 weeks (95% CI: 20.7, not reached) and 58.1 weeks (95% CI: 36.3, not reached) for patients with SS. OS probability was 90% (95% CI: 69.8, 94.0) at 12 weeks and 70% (95% CI: 49.6, 82.1) at 24 weeks. OS probability in patients with SS was 90% (95% CI: 0.63, 0.99) at 12 weeks and remained 90% (95% CI: 0.59, 0.97) at 24 weeks.

