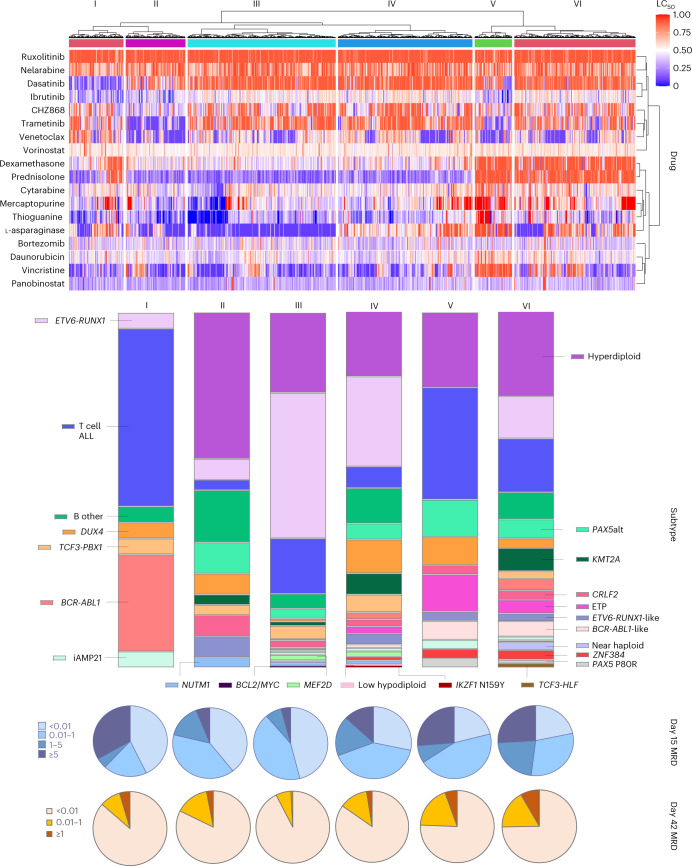
Fig. 4. Drug sensitivity profile defines distinct ALL patient clusters.
Hierarchical clustering revealed six taxonomic groups with distinct patterns of drug sensitivity, as shown on the heatmap. Hierarchical clustering of patients was performed based on all imputed LC50 values using Manhattan distance measure. Each patient received a cluster assignment for each round of imputation. Patients were assigned to a final cluster if that cluster assignment appeared in the same cluster for at least five of ten rounds of imputation. Each vertical block of the heatmap corresponds to a cluster, numbered I to VI. The heatmap depicts higher drug sensitivity in blue and higher drug resistance in red. The distribution of subtypes within each cluster is shown as bar graphs. MRD at days 15 and 42 of each cluster are indicated by the pie charts below the heatmap.

