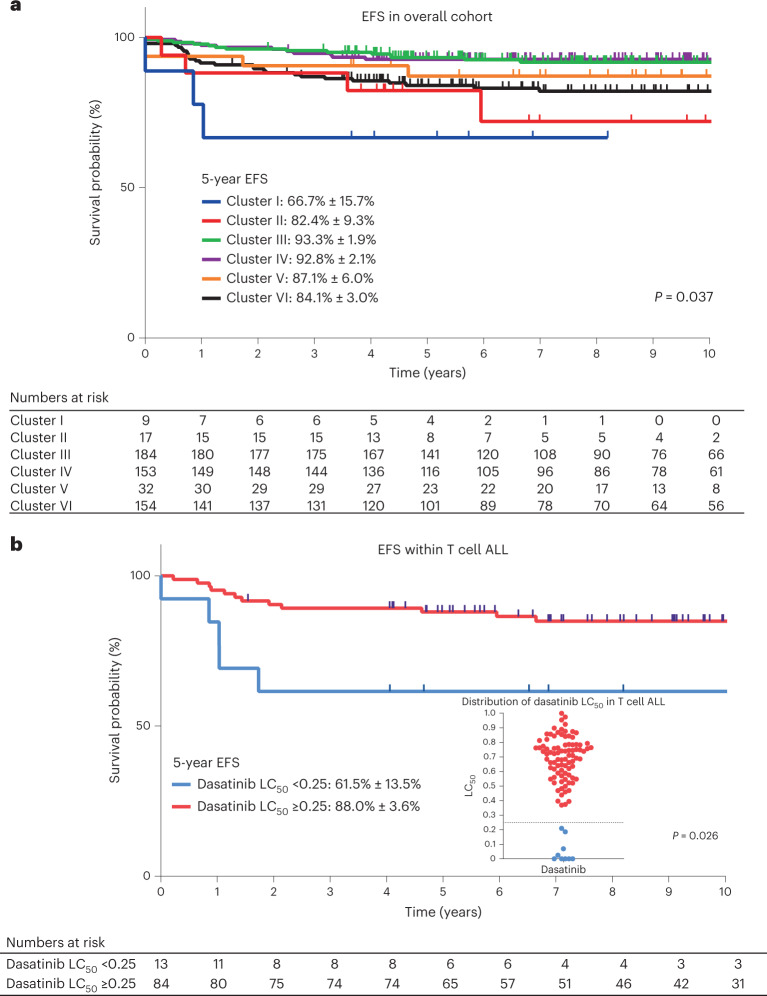
Fig. 5. Association of drug sensitivity profiles with EFS.
a, EFS across 6 drug sensitivity clusters in the entire cohort (n = 549) (a) and EFS across 2 dasatinib sensitivity groups in T cell ALL (n = 97) (b). Kaplan–Meier curves were plotted for each drug sensitivity group and the 5-year EFS with s.e. are shown in the figure. The numbers of patients at risk are shown beneath each graph. Each cluster is represented by a different color. b, The dasatinib-resistant group (LC50 ≥ 0.25) is indicated in red and the dasatinib-sensitive group (LC50 < 0.25) is indicated in blue. The dot plot in b demonstrates the distribution of dasatinib LC50 in patients with T cell ALL, with the horizontal dotted line shown at 0.25. P values were determined by two-sided Cox proportional-hazards regression test and adjusted for treatment arm.

