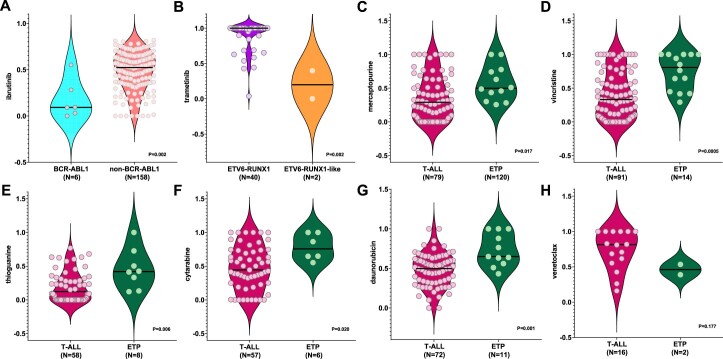
Extended Data Fig. 3. Drug LC50s comparing between ALL subtypes.
(a) Ibrutinib in BCR-ABL1 vs non-BCR-ABL1 (b) Trametinib in ETV6-RUNX1 vs ETV6-RUNX1-like (c) Mercaptopurine in T-ALL vs ETP-ALL (d) Vincristine in T-ALL vs ETP-ALL (e) Thioguanine in T-ALL vs ETP-ALL (f) Cytarabine in T-ALL vs ETP-ALL (g) Daunorubicin in T-ALL vs ETP-ALL (h) Venetoclax in T-ALL vs ETP-ALL Drug LC50s are plotted in a violin plot for selected subtypes. The median LC50 for each subtype is shown as a bold black line. The number of patients in each category is indicated in parenthesis and represents biologically independent samples. Nominal P values comparing LC50s are as shown and determined by the 2-sided Mann-Whitney test.

