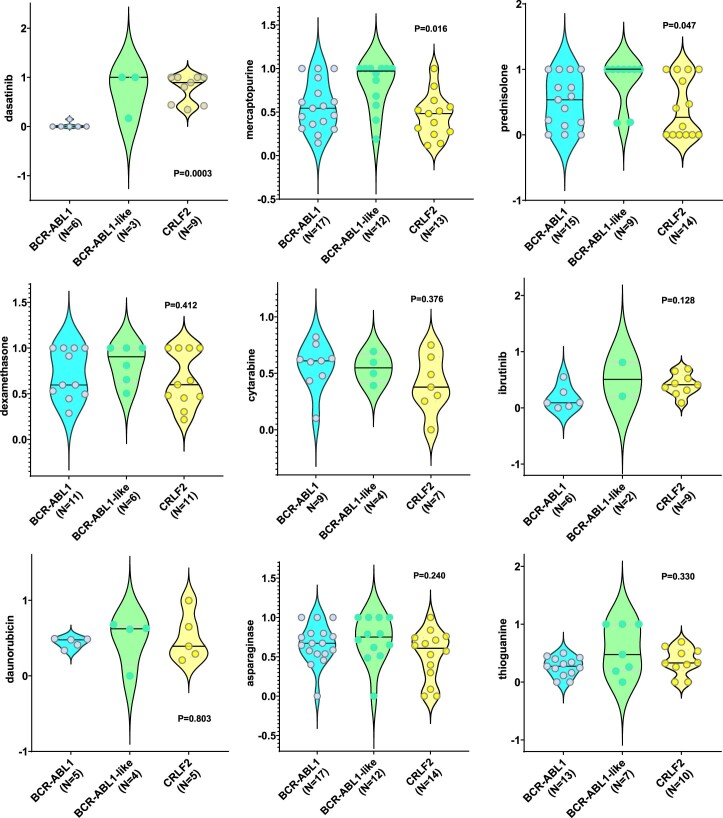
Extended Data Fig. 4. Drug LC50s comparing BCR-ABL1, BCR-ABL1-like, and CRLF2-r ALL.
Drug LC50s are plotted in violin plots for these three subtypes. The median LC50 for each subtype is shown as a bold black line. The number of patients in each category is indicated in parenthesis and represents biologically independent samples. Amongst the 3 BCR-ABL1-like cases tested for dasatinib, 2 harbored ABL class fusions (one with PDGFRB, and one with CSFR1). Nominal P-values are as shown and determined by 2-sided Kruskal-Wallis test.

