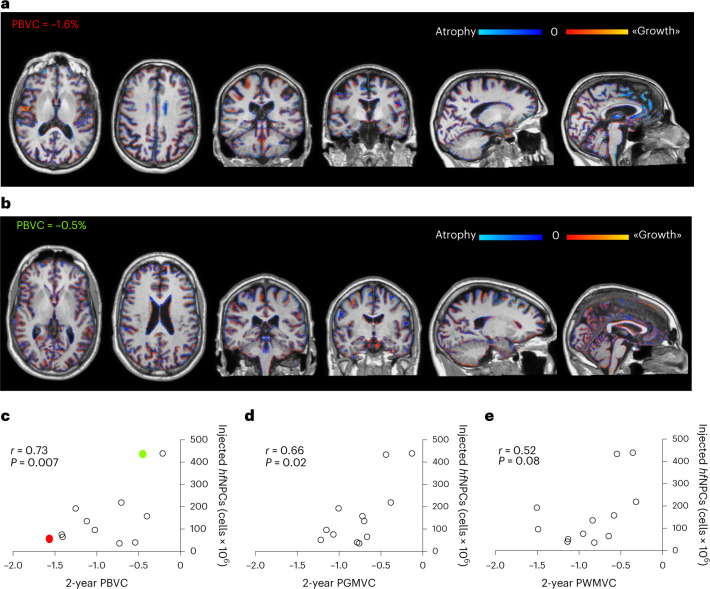
Fig. 2. The number of injected hfNPCs inversely correlates with brain volume loss.
Color-coded areas of brain atrophy (blue) and growth (red) representing PBVC at 2 years from hfNPC transplantation in two representative patients, respectively, receiving a low dose (a, red in c) and high dose (b, green in c) of hfNPCs. c, Lower rates of total brain atrophy (percentage of brain volume change [PBVC]) significantly correlate with the number of injected hfNPCs (r = 0.73, P = 0.007). Two-sided Spearman’s correlation test. d, Lower rates of GM atrophy (percentage of gray matter volume change [PGMVC]) significantly correlate with the number of injected hfNPCs (r = 0.66, P = 0.02). Two-sided Spearman’s correlation test. e, Although not statistically significant, lower rates of brain WM atrophy (percentage of white matter volume change [PWMVC]) seem to correlate with high number of injected hfNPCs (r = 0.52, P = 0.08). Two-sided Spearman’s correlation test.

