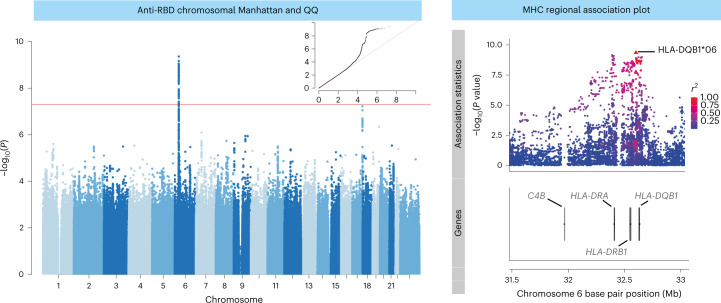
Fig. 2. Genome-wide and MHC SNP associations with RBD antibody level in 1,076 ChAdOx1 nCoV-19 vaccine recipients from the COV001 and COV002 vaccine trials.
The association results for all tested autosomal and X chromosome variants with linear regression in a mixed-model framework are shown on the left in a Manhattan plot, with the red horizontal line representing the nominal threshold for GWAS significance (P = 5 × 10⁻⁸) to account for the multiple tests performed. The QQ plot in the inset of the Manhattan plot on the left of the figure with expected P values shown on the x axis and observed on the y axis. A magnified view of a portion of the MHC locus is shown on the right of the figure. All points represent SNPs or HLA alleles positioned by build 37 of the human genome coordinates and colored on the right by linkage disequilibrium (r2), with relevant gene coordinates provided in the lower panel.

