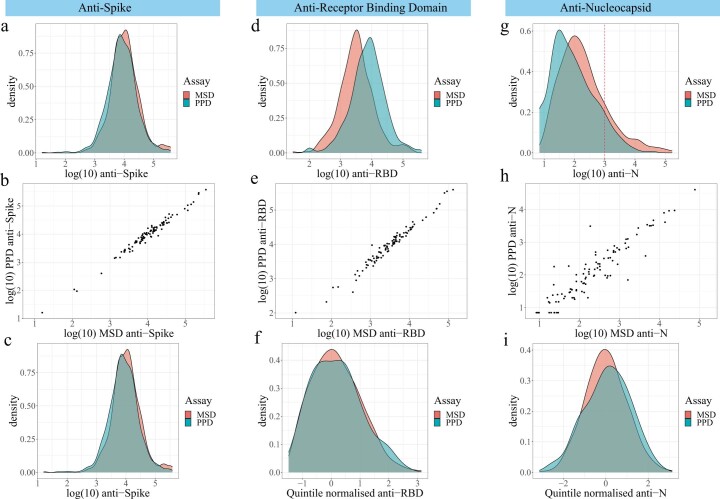
Extended Data Fig. 1. Immunoassay distributions.
IgG antibody responses against SARS-CoV-2 spike (S, panels a-c), receptor binding domain (RBD, panels d-f) and nucleocapsid (N, panels g-i)) were measured for COV001 and COV002 participants in two laboratories: MSD and PPD. For 97 individuals, measures were available from both laboratories. The density distributions of measures from each laboratory for each antigen (panels a, d and g) and the correlation between intra-individual measures (panels b rho 0.98, e rho 0.98, and h rho 0.90) were inspected. If the density distributions overlapped and the intra-individual correlation (r2) was greater than 0.7, the original distributions were taken forward for analysis (as for S, panel c). However if r2 was less than 0.7, the quintile normalised intra-laboratory measures were taken forwards for analysis (panels f and i).

