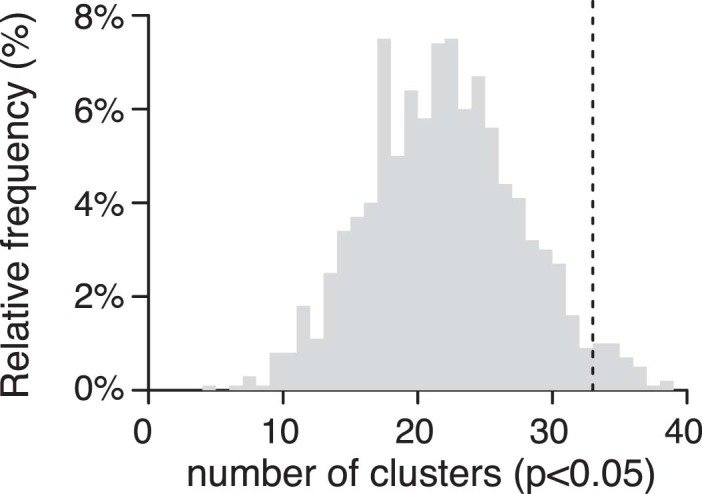
Extended Data Fig. 5. Number of TCR clusters that pass a nominal p-value threshold in permutation analysis when disease outcome label is randomized.

Histogram showing the distribution of the number of TCR clusters identified at a nominal p value < 0.05 when controller and progressors status was randomized in permutation analyses with 1000 iterations. The vertical line on the right indicates the number of TCR clusters observed when the correct controller or progressor classification was used (33). 44 (4.4%) of the 1000 iterations exceeded 33.
