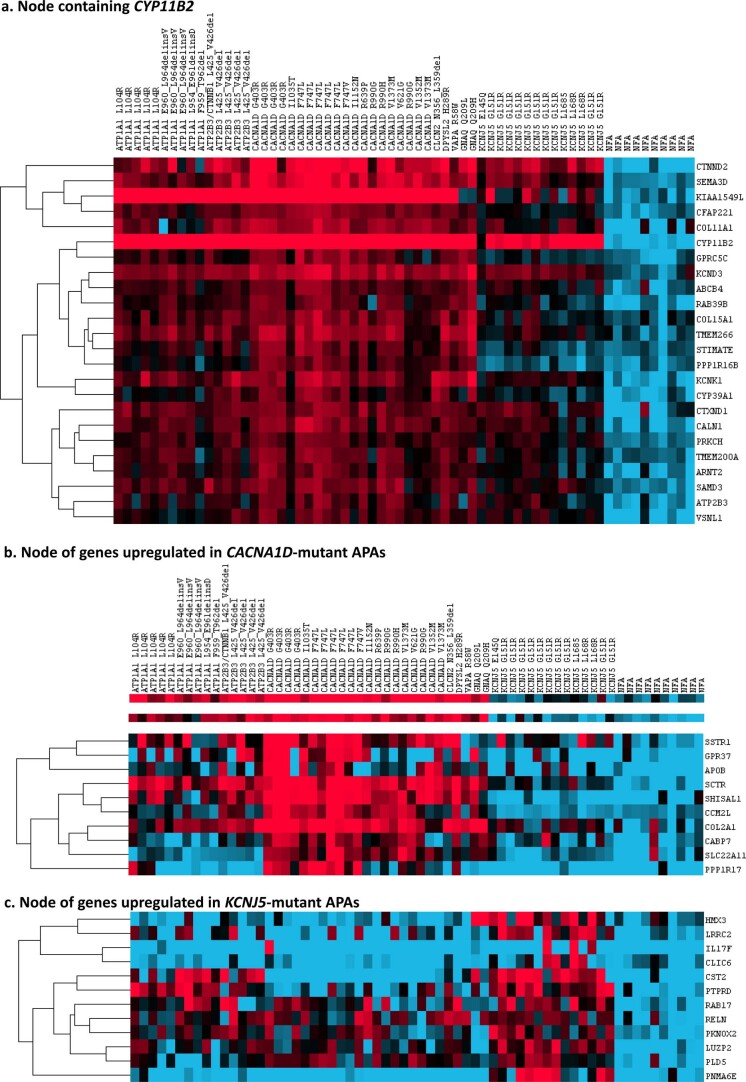
Extended Data Fig. 7. Heat map representation of differentially expressed genes between APAs and NFAs, and between genotypes.
Each column represents the expression profile of the APA or NFA. Both genes and individual APAs are hierarchically clustered. Three nodes of interest are shown: a. node containing CYP11B2; b. node showing most upregulated genes in CACNA1D-mutant APAs. c. node showing most upregulated genes in KCNJ5-mutant APAs. The CYP11B2 nodes includes several genes previously noted to be upregulated in APAs, for example VSNL1, CALN1. Genes which are significantly upregulated in APMs are also seen in this node: TMEM266 (TMEM266 (C15ORF27), PPP1R16B, SEMA3D, KIAA1549L (C11ORF41), CFAP221 (PCDP1). Red represents upregulation and blue represents downregulation of genes. APA, aldosterone producing adenoma; AAG, adjacent adrenal gland; IHC, immunohistochemistry; NFA, non-functioning adenoma; APM, aldosterone producing micronodule (previously known and aldosterone producing cell clusters, APCCs).

