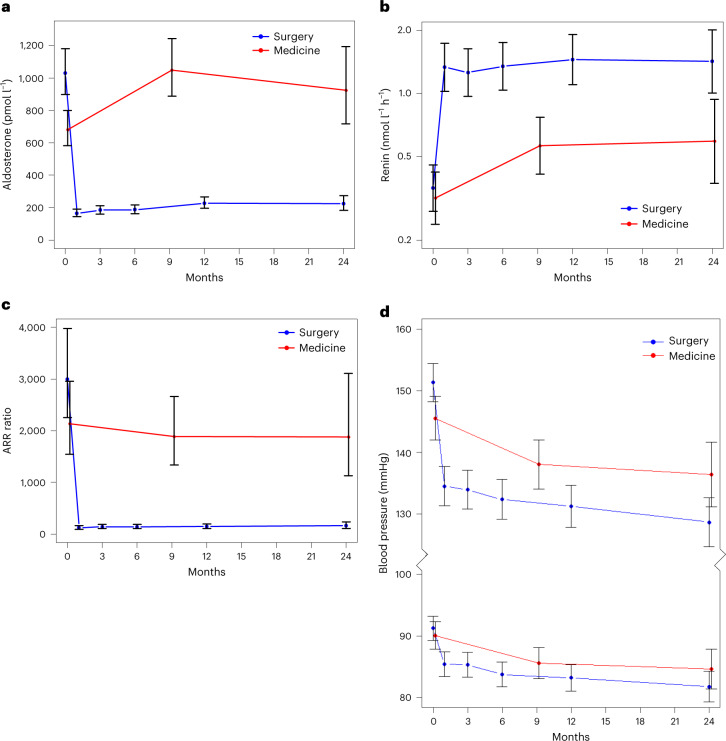
Fig. 3. Secondary (pre- and post-intervention) outcomes.
a, Change in plasma aldosterone levels. For the surgical group, n = 80 at 0 months, n = 66 at 6 months, n = 57 at 12 months and n = 28 at 24 months. For the medical group, n = 59 at 0 months, n = 50 at 9 months and n = 18 at 24 months. b, Change in plasma renin activity. For the surgical group, n = 74 at 0 months, n = 69 at 6 months, n = 57 at 12 months and n = 29 at 24 months. For the medical group, n = 60 at 0 months, n = 48 at 9 months and n = 17 at 24 months. c, Change in the ARR. For the surgical group, n = 74 at 0 months, n = 66 at 6 months, n = 55 at 12 months and n = 28 at 24 months. For the medical group, n = 58 at 0 months, n = 48 at 9 months and n = 16 at 24 months. Reduction in aldosterone, de-suppression of renin and consequent reduction in ARR were seen post-surgery. ARR remained unchanged with medical therapy. d, Reduction in systolic and diastolic home blood pressure post-treatment. All effects seen were sustained for at least 2 years. For the surgical group, n = 76 at 0 months, n = 67 at 6 months, n = 56 at 12 months and n = 33 at 24 months. For the medical group, n = 59 at 0 months, n = 41 at 9 months and n = 19 at 24 months. The data represent least-squares means from mixed-effects models, adjusted for baseline covariates. Error bars show 95% CIs. 0 months indicates the baseline visit. Reference ranges were 150–550 pmol l−1 for aldosterone, 0.5–3.0 nmol l−1 h−1 for renin activity and <1,000 pmol l−1 (nmol l−1 h−1) for ARR (activity).

