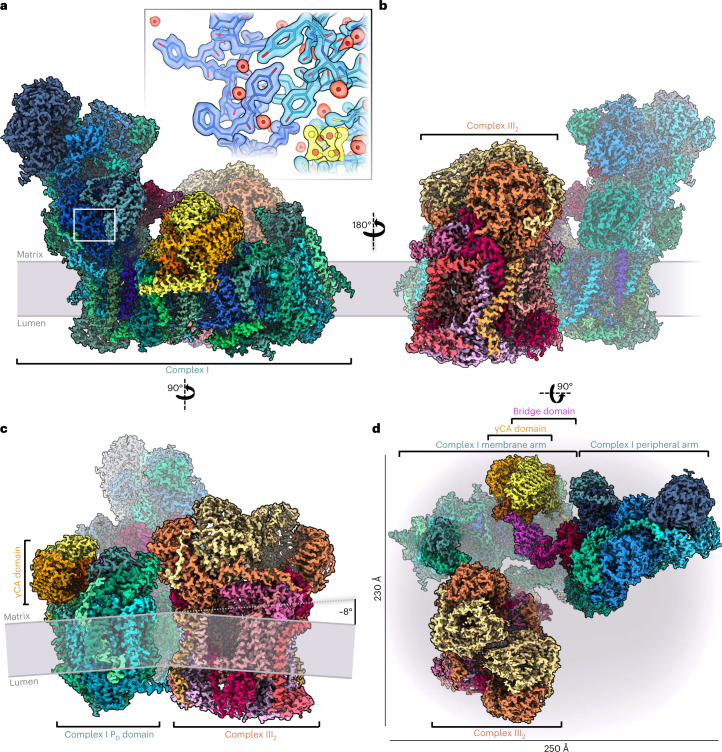
Fig. 1. 2 Å structure of the Arabidopsis I + III2 supercomplex.
a–c, Views from the plane of the inner mitochondrial membrane (grey), with complex I in front (a), with complex III2 in front (b), and from the tip of the complex I membrane arm (c). The supercomplex protrudes into the mitochondrial matrix and the cristae lumen. The 14 complex I core subunits, which are conserved in bacterial and mitochondrial complex I, are drawn in shades of blue; accessory subunits in shades of green; the three subunits of the γCA module in yellow, orange and red; the three subunits of the bridge module in pink, purple and red. In a, the inset shows a typical map region near FeS cluster N2 (yellow), and water densities are red. In c, the inner mitochondrial membrane bends by ~8° around the supercomplex. d, Matrix view of the I + III2 supercomplex. Subunits protruding from the membrane are shown in strong colours. For detailed view of the high-resolution structure, see Supplementary Videos 1 and 2. For cryo-EM data processing and activity measurements, see Supplementary Figs. 2–5. All subunits are identified in Fig. 2. For comparison with the low-resolution map of the supercomplex obtained by single-particle negative-stain EM23, see Supplementary Fig. 6.

