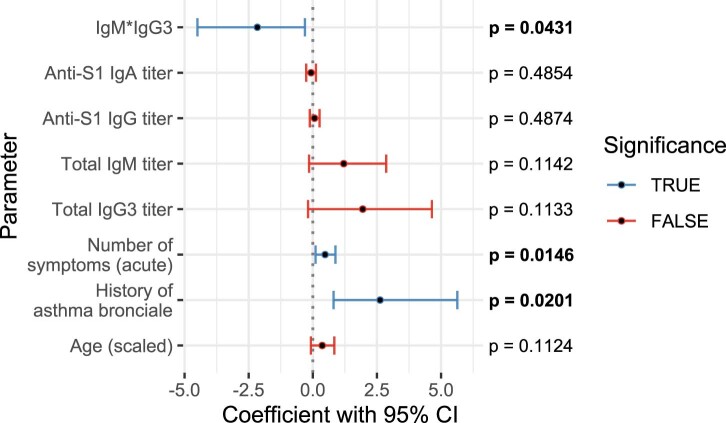
Extended Data Fig. 8. PASC prediction by total Ig in independent data set is independent of anti-spike Ig.
Plot of logistic regression model and P values (2-sided likelihood ratio test, no adjustment for multiple testing) for prediction of PASC (n = 134 subjects, 85 with PASC). The y axis lists all non-intercept coefficients, and the x axis shows the coefficient values, with the black center point showing the fitted value and the error bars showing the 95% confidence interval (CI) about this value. CIs that include 0 are colored red, while those that indicate a significant difference from 0 (p < 0.05) are colored blue.

