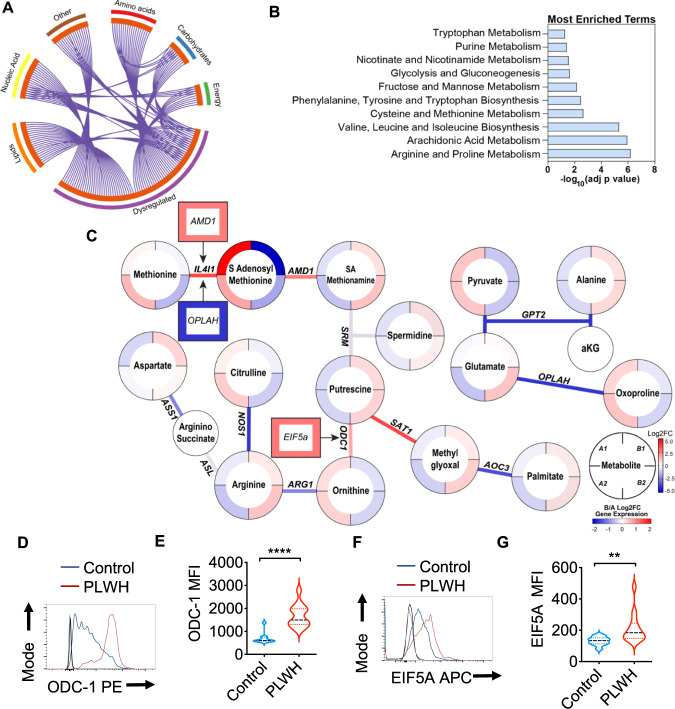
Fig. 1. Salivary metabolome analysis in conjunction with transcriptome and flow cytometry analysis of gingival immune cells.
Metabolite levels were determined by LC-MS in saliva samples from healthy controls (Group A) and PLWH (Group B) (uninfected controls n = 26; PLWH; n = 40). Genes are mapped to pathways (Kegg, GO, Reactome), and the algorithm calculates the fold change and p-value between how many hits were input and how many hits would be expected from random chance. Log10 adjp-value indicates the significance of each term compared to random chance, larger values indicate higher likelihood that the pathway is truly enriched. Pathways are analyzed individually with no comparisons made. A Circos plot linking genes significantly dysregulated between groups A and B (purple outer ring) to their associated KEGG pathways via purple line. Graph was generated via Metascape. B Overall the most enriched terms by -log10p value were generated using dysregulated genes and metabolites via Metaboanalyst 5.0. C Genes and metabolites associated with the most enriched term, Arginine proline metabolism. Circles represent metabolites ringed by Log2FC (PLWH vs Controls). Lines represent enzymatic genes colored by Log2FC. Rectangles indicate genes not directly involved in enzymatic reactions but are upstream or downstream of the linked metabolites, ringed by Log2FC. Metabolite changes were considered significant if they reached a threshold of Log2FC = 1, p < 0.05. Cells from gingival mucosa were processed for flow cytometry and stained for intracellular ODC-1 (Control n = 10; PLWH n = 13) (D, E) and EIF5A (Control n = 10; PLWH n = 14) (F, G). Light and dark gray histograms represent staining controls for Control and PLWH cells respectively. Flow cytometry analysis was conducted gating on CD4+ T cells. E and G show the respective statistical analysis of geometric mean fluorescence intensity (MFI). Median values ± SEM are plotted. (Mann–Whitney U test ****P < 0.0001; **P = 0.007; Two-tailed). Circles within box plots represent each replicate.

