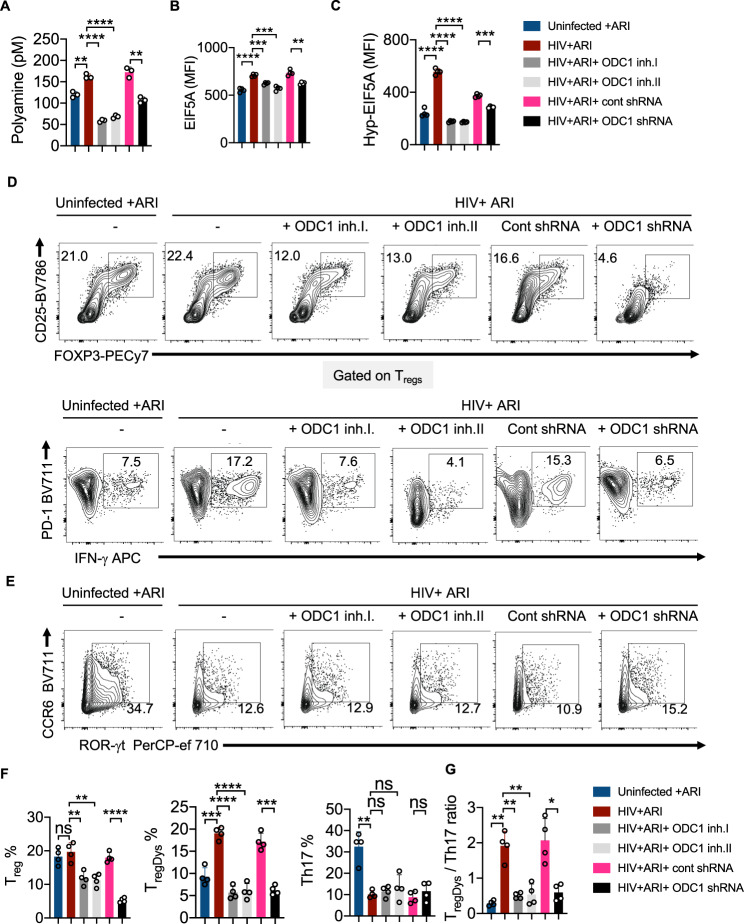
Fig. 5. HIV-1 infection associated Th dysregulation is dependent on ODC-1 activity.
HTOC CD4+ T cells were TCR activated and infected with HIV. ARI (Efavirenz; 50 nM), DFMO (ODC-1 inhibitor I; 2.5 mM), POB (ODC-1 inhibitor II; 100 μM), Control shRNA lentiviral particles-A with polybrene (2 μg/ml), and ODC1 shRNA lentiviral particles with polybrene (2 μg/ml) were added as indicated, 36 h post-infection. A Fluorometric polyamine estimation in cell lysates on day 6 post- infection. n = 3 independent experiments; Mean values +/− SD; **P < 0.003; ****P < 0.0001; Two-tailed; Welch’s t test. B Statistical analysis of EIF5A expression (MFI), and C Statistical analysis of hypusinated EIF5A expression (MFI) from three experiments. Flow cytometric overlays are provided in Supplementary Fig. 13. D Contour plots showing FOXP3 and CD25 (Tregs) expression in CD4 cells (above) and PD-1 and IFN-γ (TregDys) in FOXP3+cells (below). E Contour plots showing ROR-γt and CCR6 expression (Th17) in CD4 cells. Quantification of Treg, TregDys, Th17 (F), and TregDys/Th17 ratios (G) based on the data from D and E. Data are representative of four (n = 4) independent experiments and are presented as mean values +/− SEM. ****P < 0.0001; ***P = 0.0001; **P < 0.005; *P < 0.02; Two-tailed; Unpaired t test in A–C and F–G. Circles within box plots represent each replicate.

