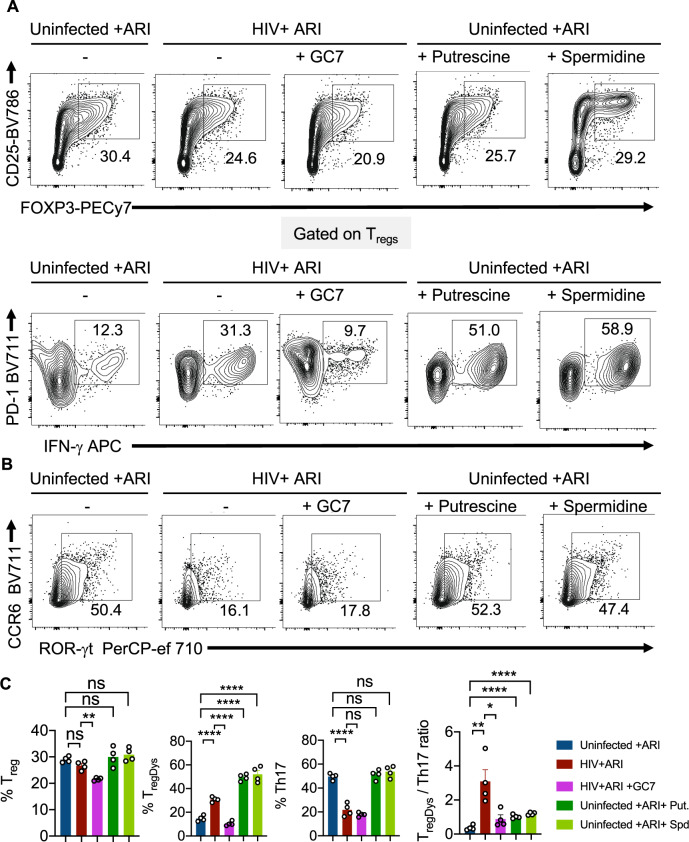
Fig. 7. HIV-induced skewing of TregDys /Th17 ratios requires polyamine synthesis.
HTOC CD4+ T cells were stimulated as described in the methods. Some cultures were HIV-infected with or without GC7 (10 μM). Other uninfected cultures were treated with Putrescine dihydrochloride (100 μM) or Spermidine (1 mM). A Contour plots showing the percentage of Tregs (above) and PD-1hiIFN-γ+ cells in FOXP3+ population (TregDys) (below). B Contour plots showing ROR-γt and CCR6 expressing CD4+ T cells (Th17). C Quantification of TregDys/Th17 ratios as determined by flow cytometry analyses in A and B. Results represent four experiments with similar results and are presented as mean values +/− SEM. ****P < 0.0001; ***P = 0.0004; **P = 0.007; *P < 0.02; Two-tailed; Unpaired t test in C. Circles within box plots represent each replicate.

