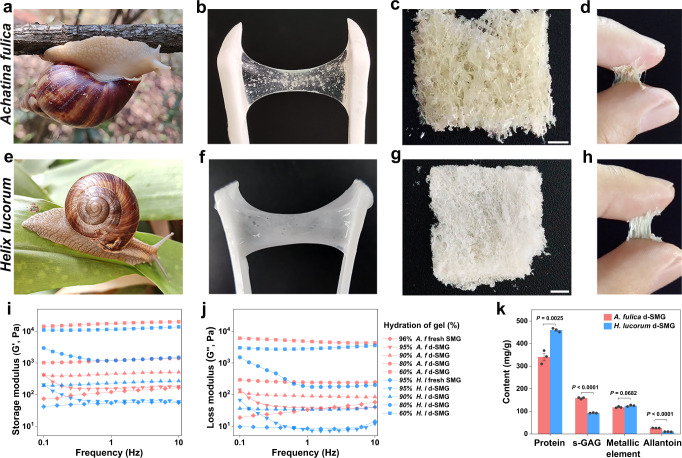
Fig. 1. Characterizations of d-SMGs.
a–d Photograph of A. fulica (a), fresh mucus from A. fulica (b), d-SMG from A. fulica (c), and adhesion of A. fulica d-SMG on skin (d). e–h Photograph of H. lucorum (e), fresh mucus from H. lucorum (f), d-SMG from H. lucorum (g), and adhesion of H. lucorum d-SMG on skin (h). i–j Storage modulus (i) and loss modulus (j) of SMG and d-SMG with different hydration ratio (red for A. fulica, and blue for H. lucorum). k The main components of the two d-SMGs (n = 3 biologically independent samples in each group). For k, two-tailed t test was used. Data are presented as mean values + /- SEM. Scale bars, 2 mm (images in c, g). Source data are provided as a Source data file.

