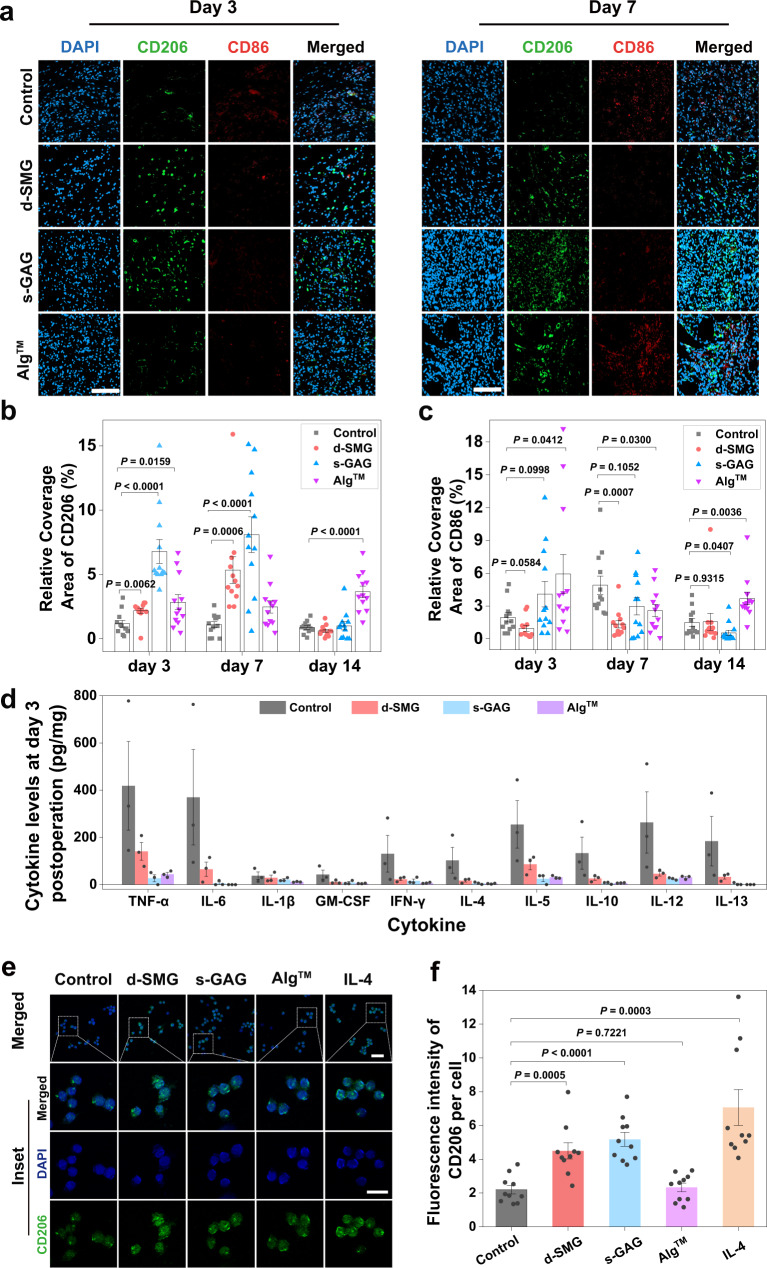
Fig. 7. Effects of A. fulica d-SMG and s-GAG for inflammatory regulation in vivo.
a Representative image of CD206 and CD86 immunostaining in wound tissue on day 3 and 7. b Quantification of CD206+ area in the wound tissue (n = 12 biologically independent samples in each group). c Quantification of CD86+ area in the wound tissue ((n = 12 biologically independent samples in each group). d Cytokine levels in wound tissue on day 3 (n = 3 biologically independent samples in each group). e Representative images of CD206 and DAPI staining of RAW264.7. f Quantification of the fluorescence intensity of CD206 in RAW264.7 cells (n = 10 biologically independent cells in each group). For (b–d and f), two-tailed t test was used. Data are presented as mean values ± SEM. Scale bars, 100 μm (images in a), 50 μm (images in e), 25 μm (inset in e). Source data are provided as a Source data file.

