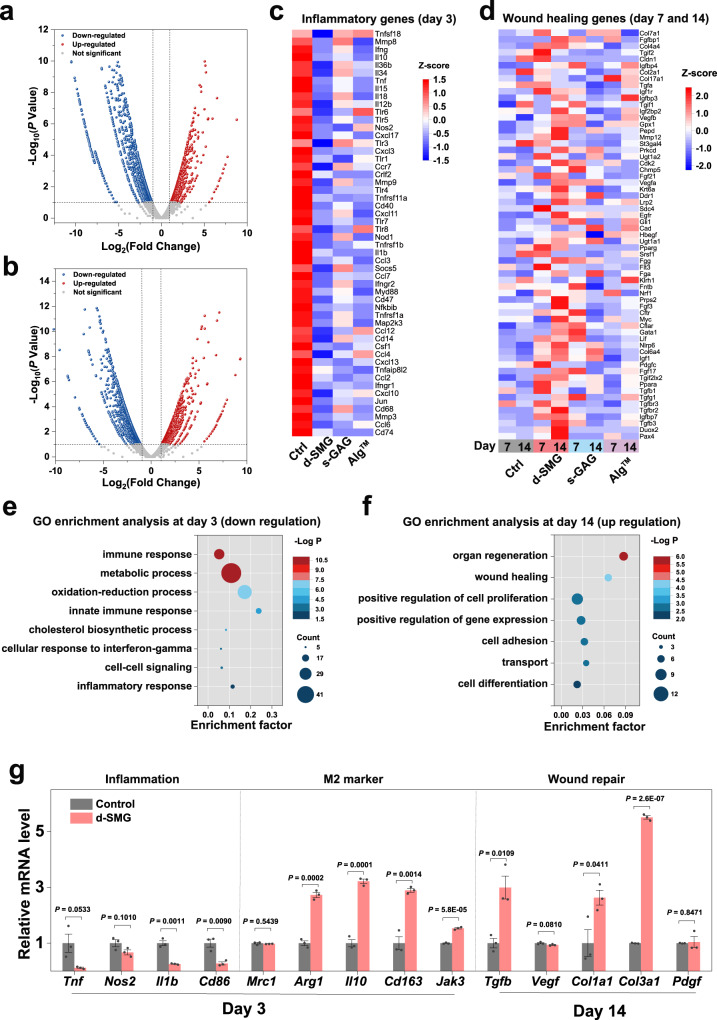
Fig. 8. Analysis of differentially expressed genes in diabetic wound tissue.
a, b Volcano plots showing the upregulated and downregulated genes in d-SMG group on day 3 (a) and 14 (b). c, d Heat map of inflammation genes on day 3 (c) and wound healing genes on day 7 and 14 (d). e Gene ontology (GO) enrichment analysis of the downregulated genes on day 3. f GO enrichment analysis of the upregulated genes on day 14. g The relative mRNA level in the diabetic wound tissue evaluated using real-time qPCR (n = 3 biologically independent samples in each group). For (a, b), Wald test was used; For (e,f), Hypergeometric tests and Benjamini–Hochberg FDR control procedures were used; For (g), two-tailed t test was used. Data are presented as mean values ± SEM. Source data are provided as a Source data file.

