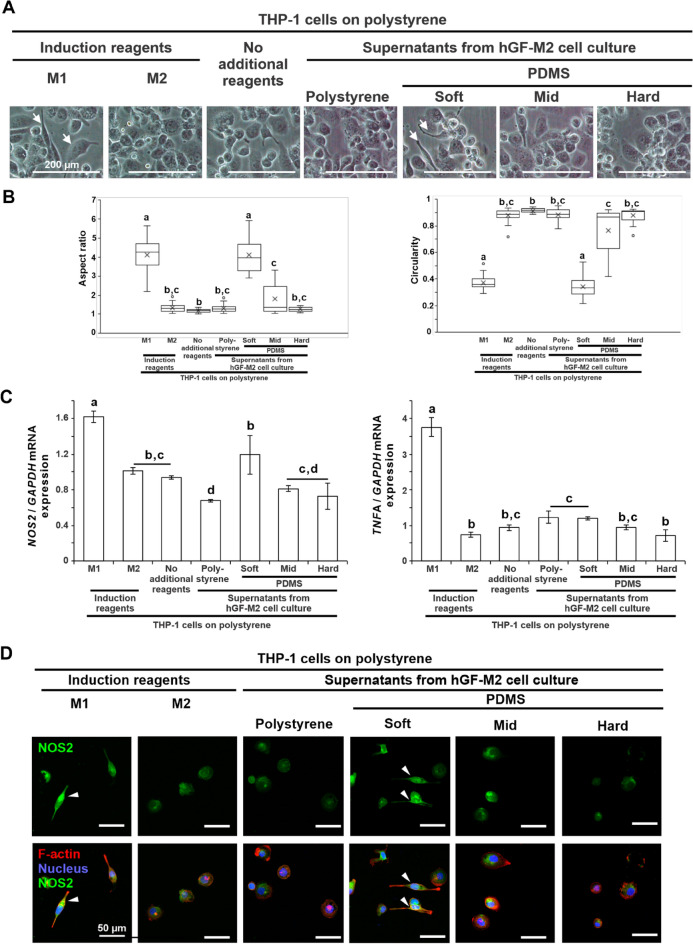
Figure 2.
Effects of substrate stiffness on the immunostimulatory activity of hGFs. (A) Representative phase microscopic images, (B) the corresponding cytomorphometric parameters, aspect ratio and circularity, (C) reverse transcription-polymerase chain reaction (RT-PCR)-based gene expression analysis of NOS2 and TNFA relative to GAPDH and (D) immunofluorescence confocal laser microscopic images of NOS2 (green), F-actin (red), and nucleus (blue) in THP-1 cell cultures on a polystyrene culture plate for 24 h via 12 h co-incubation with or without 50 ng/mL LPS and 20 ng/mL interferon for M1-induction, 20 ng/mL interleukin-4 and 20 ng/mL interleukin-13 for M2-induction or the culture supernatant from hGF-M2 cells on the 0.1wt% collagen-coated polystyrene culture plate and soft, mid and hard PDMS. Note phase microscopic images (A) showing elongated spindle cells (arrows) in THP-1 cells with M1-induction or the supernatant from hGF-M2 cells on the soft PDMS. Data are presented as box plots (N = 20 in B) or the means ± standard deviation (SD; N = 3 in C). Different letters indicated the statistically significant difference between them (P < 0.05; Tukey’s honestly significant difference [HSD] test). Note: (D) elongated THP-1 cells with strong NOS2 signals (triangles) were observed in the THP-1 cell culture with M1-induction or the supernatant from hGF-M2 cells on the soft PDMS. THP-1 human monocytic leukemia cell line, PDMS polydimethylsiloxane, M1, M1 macrophage cells, M2, M2 macrophage cells, LPS lipopolysaccharide, NOS2 Nitric oxide synthase 2, TNFA tumor necrosis factor-α, GAPDH glyceraldehyde-3-phosphate dehydrogenase.

