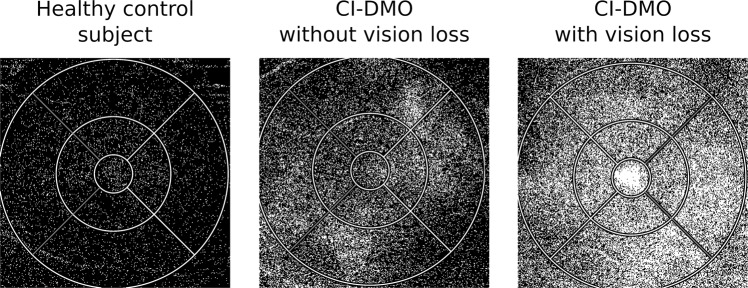
Fig. 2. OCT-Leakage maps of a healthy control and of CI-DMO eyes with and without vision loss at the 3-year follow-up visit.
OCT-Leakage LOR map for the full retina of a healthy control subject (left), a CI-DMO patient without vision loss (centre) and CI-DMO patient with vision loss (right) at the end of the follow-up period. White areas represent areas of increased extracellular space. CI-DMO: Central-involved diabetic macular oedema; LOR: Low Optical Reflectivity.

