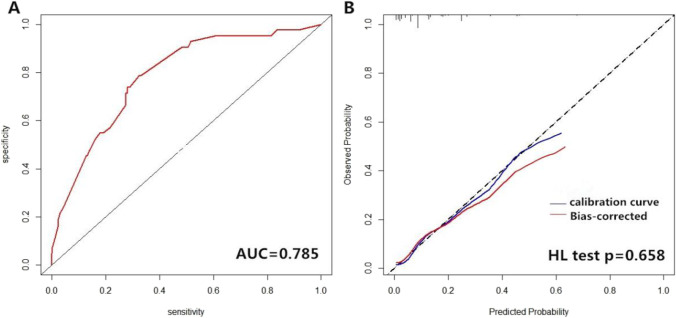
Fig. 1.
Evaluation of the performance of the risk prediction model. (A) Receiver operating characteristic (ROC) curve of the prediction model. The AUC was 0.785. (B) Calibration curve for the logistic regression model. The calibration curve was plotted with 1,000 times bootstrap resampling. The p value was calculated with Hosmer–Lemeshow (HL) goodness-of-fit test (p = 0.658). The solid blue line represents original calibration curve and the blue bands represent bias-corrected calibration curve

