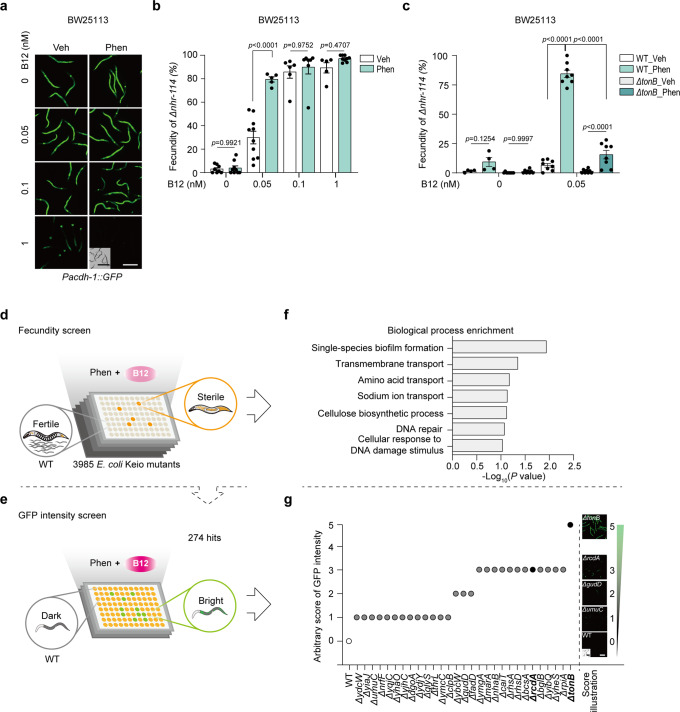
Fig. 3. Bacterial genetic screens to identify the effectors of phenformin with worm B12 sensors.
a Representative images of Pacdh-1::GFP worms fed BW25113 pretreated with various doses of B12 and/or 4 mM phenformin. N = 3 independent experiments containing at least 30 worms per group. b The fecundity of Δnhr-114 worms fed BW25113 pretreated with various doses of B12 and/or 2 mM phenformin. N = 5 independent experiments containing 1–2 replicates per experiment. c The fecundity of Δnhr-114 worms fed WT and ΔtonB bacteria pretreated with 0.05 nM B12 and/or 2 mM phenformin. N = 4 independent experiments containing 1–2 replicates each time. The statistical significance values were determined by two-way ANOVA for (b, c). Error bars denoted the S.E.M. d, e Schemes of genetic screens for genes responsible for phenformin-mediated bacterial B12 accumulation. Fecundity screen (d). The cartoons of sterile and fertile Δnhr-114 worms were adapted from our previous work25. The whole library was screened using Δnhr-114 worms treated with 2 mM phenformin and 0.05 nM B12. N = 4 independent experiments containing at least 30 worms per well and each round. GFP intensity screen (e). A total of 274 hits from the fecundity screen were screened using Pacdh-1::GFP worms treated with 4 mM phenformin and 1 nM B12. N = 3 independent experiments containing at least 30 worms per well and each round. f Biological process enrichment analysis of 274 hits from the fecundity screen. g The fluorescence scores of Pacdh-1::GFP worms on WT and 28 hits from the GFP intensity screen. Scale bar: 250 μm (fluorescence images) and 500 μm (bright field images) for (a) and (g).

