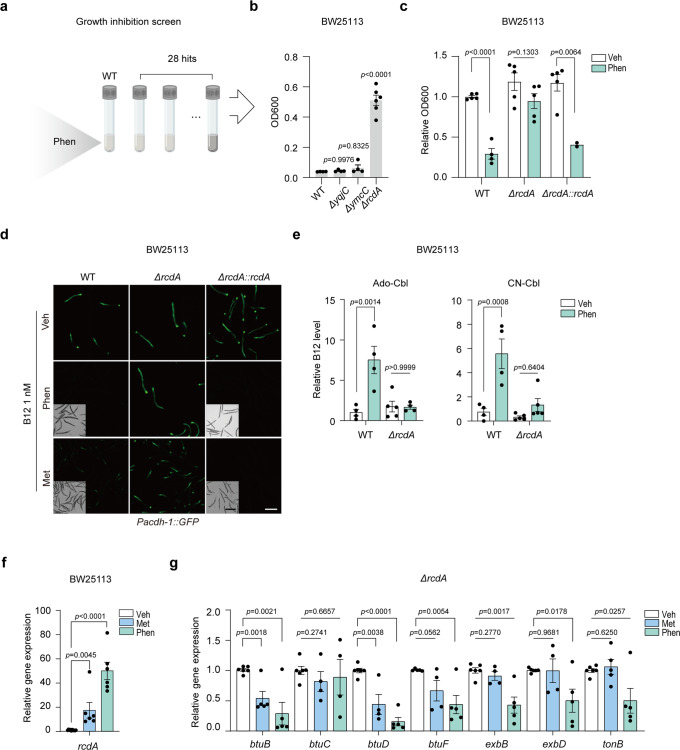
Fig. 4. Biguanides induce bacterial growth inhibition and B12 accumulation through RcdA.
a Scheme of the growth inhibition screen. The growth statuses of 28 hits from the secondary screen after treatment with 5 mM phenformin were evaluated by optical density. b The outcomes of the growth inhibition screen. OD600 value measurement of WT, ΔyqjC, ΔymcC, and ΔrcdA. N = 2 independent experiments containing 6 replicates. c Growth of WT, ΔrcdA, and ΔrcdA::rcdA cells treated with 4 mM phenformin. N = 2 independent experiments containing 2–5 replicates. d Representative images of Pacdh-1::GFP worms fed WT, ΔrcdA, and ΔrcdA::rcdA pretreated with 4 mM phenformin/200 mM metformin or not. N = 3 independent experiments containing at least 30 worms per group. Scale bar: 250 μm (fluorescence images) and 500 μm (bright field images). e LC-MS/MS measurement of B12 levels in WT and ΔrcdA treated with 4 mM phenformin or untreated. N = 3 independent experiments containing 4–5 replicates. f Relative mRNA levels of rcdA with 200 mM metformin or 4 mM phenformin treatment. g Relative mRNA levels of genes involved in B12 transport in ΔrcdA with 200 mM metformin or 4 mM phenformin treatment. For (f, g), N = 2 independent experiments containing 4–6 replicates. The statistical significance values were determined by ordinary one-way ANOVA for (b) and (e) and multiple t tests for (c) and (f, g). Error bars denoted the S.E.M.

