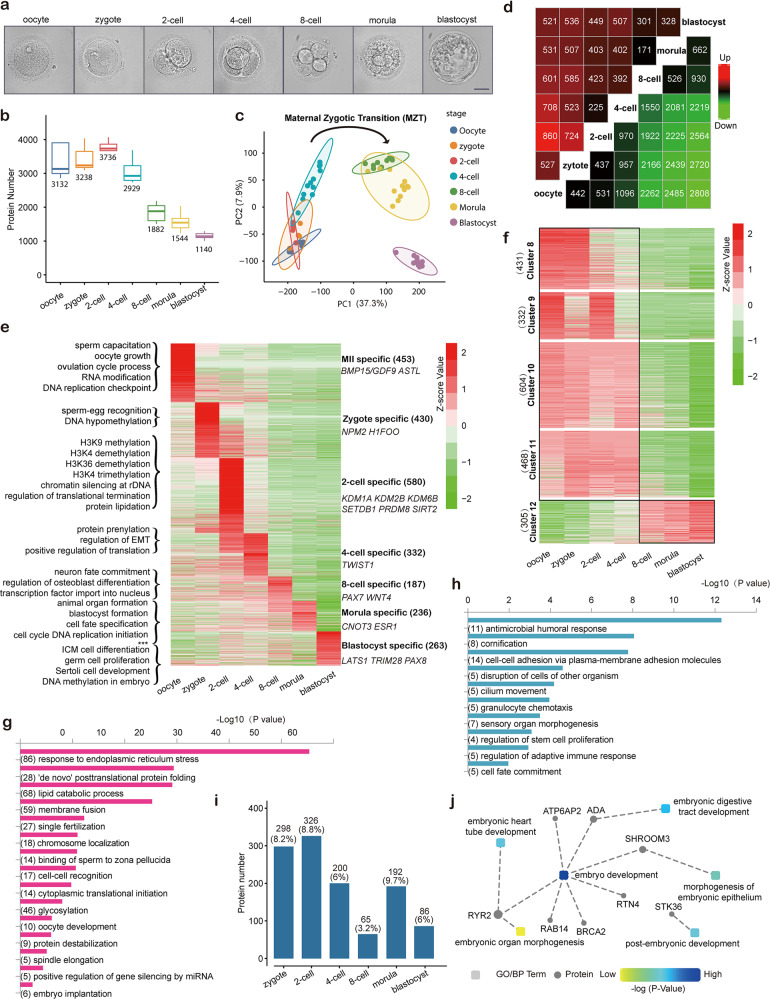
Fig. 1. Landscape of dynamic protein expression during human pre-implantation development.
a Representative microscopy images of a human mature (MII) oocyte (5 samples were analyzed) and early embryos at the following stages: zygote (2 pronuclear (2PN) embryo) (5 samples), 2-cell (4 samples from 2 embryos), 4-cell (13 samples from 3 embryos), 8-cell (9 samples from 1 embryo), morula (12 samples), blastocyst (10 samples). Scale bar, 50 µm. b Box plot showing the number of proteins detected in single oocytes or blastomeres. Median values are shown. c Proteomic PCA of single oocytes and blastomeres during human pre-implantation development. d Number of DEPs (fold change > 2 or < 0.5) at each stage compared with the other stages. e Heatmap of stage-specific proteins including their normalized expression levels (Z-score value), marker proteins (at right), protein numbers (at right) and specific GO-terms (at left). *** represents GO terms of ‘RNA polymerase II transcriptional pre-initiation complex assembly’ and ‘regulation of translation initiation in response to endoplasmic reticulum stress’ at the morula stage. f Heatmap of corresponding maternal-translated (clusters 8–11) and zygotic-translated proteins (cluster 12). Numbers of proteins are shown in brackets. g GO analysis of maternal-translated proteins. Numbers of proteins participated in the terms are shown in brackets. h GO analysis of zygotic-translated proteins. Numbers of proteins participated in the terms are shown in brackets. i Histogram showing the number of de novo expressed ‘prime-state genes’ at each stage. Percentages of de novo expressed ‘prime-state’ proteins to all expressed proteins are shown in brackets. j Identification of biological processes (BP) in embryo development based on analysis of the conserved proteins. Square nodes represent BP terms; circular nodes represent related proteins.

