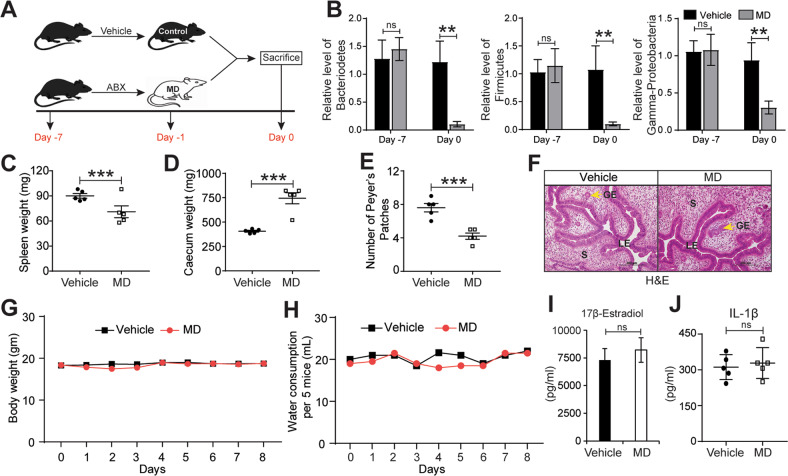
Fig. 1. Generation of microbiota-depleted mice using antibiotics.
A Schematic of experimental timeline and procedures. B Quantification of relative abundances of Bacteroidetes, Firmicutes, and Gamma-proteobacteria in feces from vehicle and Microbiota-depleted (MD) mice. C-D Wet weights of C spleen and D caecum in indicated treatment groups at a sacrifice. E The number of Peyer’s patches from indicated treatment groups. F Representative images of Hematoxylin and Eosin-stained uterine cross-sections from the indicated treatment groups. LE, Luminal Epithelium; GE, Glandular Epithelium; S, Stroma. Yellow arrows indicate the gland. G-H Mouse G body weight and H water consumption at indicated time points in vehicle and MD mice. I-J Relative level of I 17β-Estradiol in serum and J IL-1β in peritoneal fluid of indicated treatment groups. Data are presented as mean ± SE (n = 5 mice per group). **P < 0.01, ***P < 0.001, and ns, non-significant.

