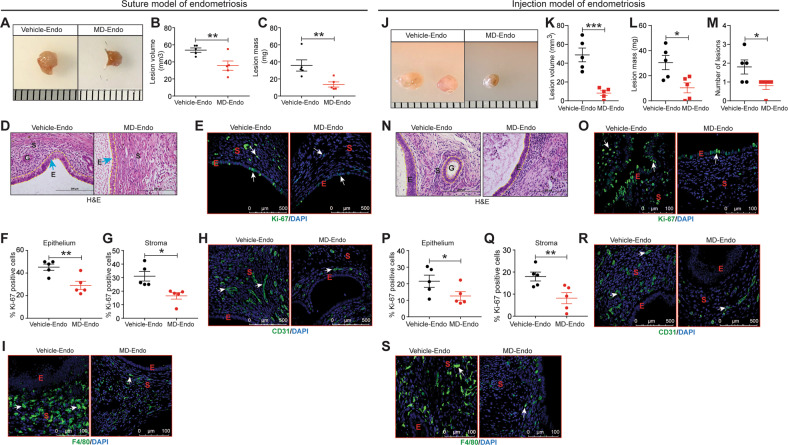
Fig. 2. Gut microbiota promotes endometriosis disease progression in mice.
A, J Ectopic endometriotic lesion representative images from A suture model J injection model. B, K The endometriotic lesion volumes from B suture model and K injection model. C, L The endometriotic lesion masses from C suture model and L injection model from the indicated groups 21 days postinduction of endometriosis. M Number of lesions per mouse in injection model from the indicated groups 21 days post-induction of endometriosis. D, N Representative images of ectopic lesions from D suture model and N injection model from the indicated treatment groups stained with Hematoxylin & Eosin (H&E). E, O Representative images of ectopic lesions from E suture model and O injection model from the indicated treatment groups stained with anti-Ki-67 antibody. F, P Percentages of Ki-67-positive cells in endometriotic lesion epithelium, F suture model and P injection model; G, Q stroma, G suture model and Q injection model. Representative images of ectopic lesions stained with H, R anti-CD31 in H suture model and R injection model; I, S anti-F4/80 I suture model and S injection model from the indicated treatment groups. White arrows indicate positive cells. Data are presented as mean ± SE (n = 5), *P < 0.05, **P < 0.01 and ***P < 0.001.

