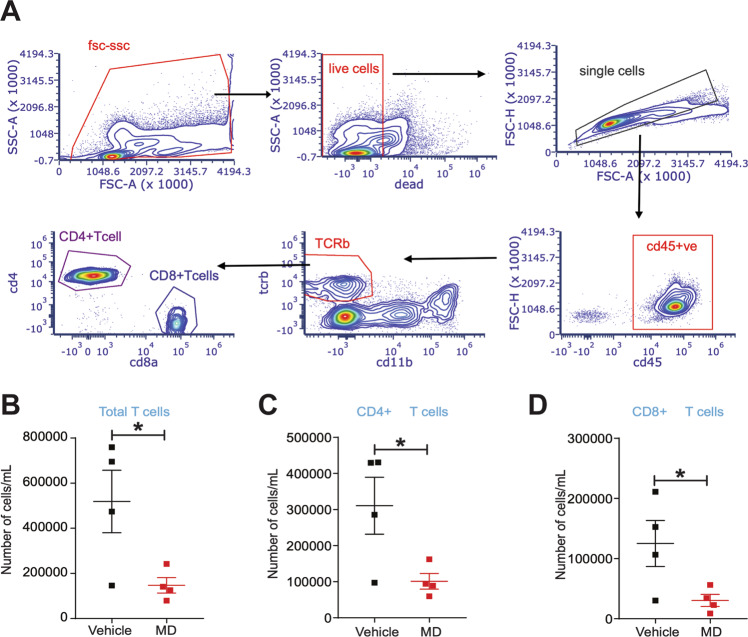
Fig. 6. Gut microbiota depletion affects total, CD4+ and CD8+ T cell population in the peritoneal fluid from mice with endometriosis.
A Flowchart of Flow cytometric plots for the cell sorting using Cytek. B-D The relative number of B total T cells per mL, C CD4+ T cells per mL and D CD8+ cells per mL in the peritoneal fluid from vehicle and MD mice. The endometriosis was induced in the vehicle and MD mice as shown in Fig. S1B and flow cytometric analysis was carried out on the peritoneal fluid 21 days after the induction of endometriosis. Data are presented as mean ± SE (n = 4), *P < 0.05.

