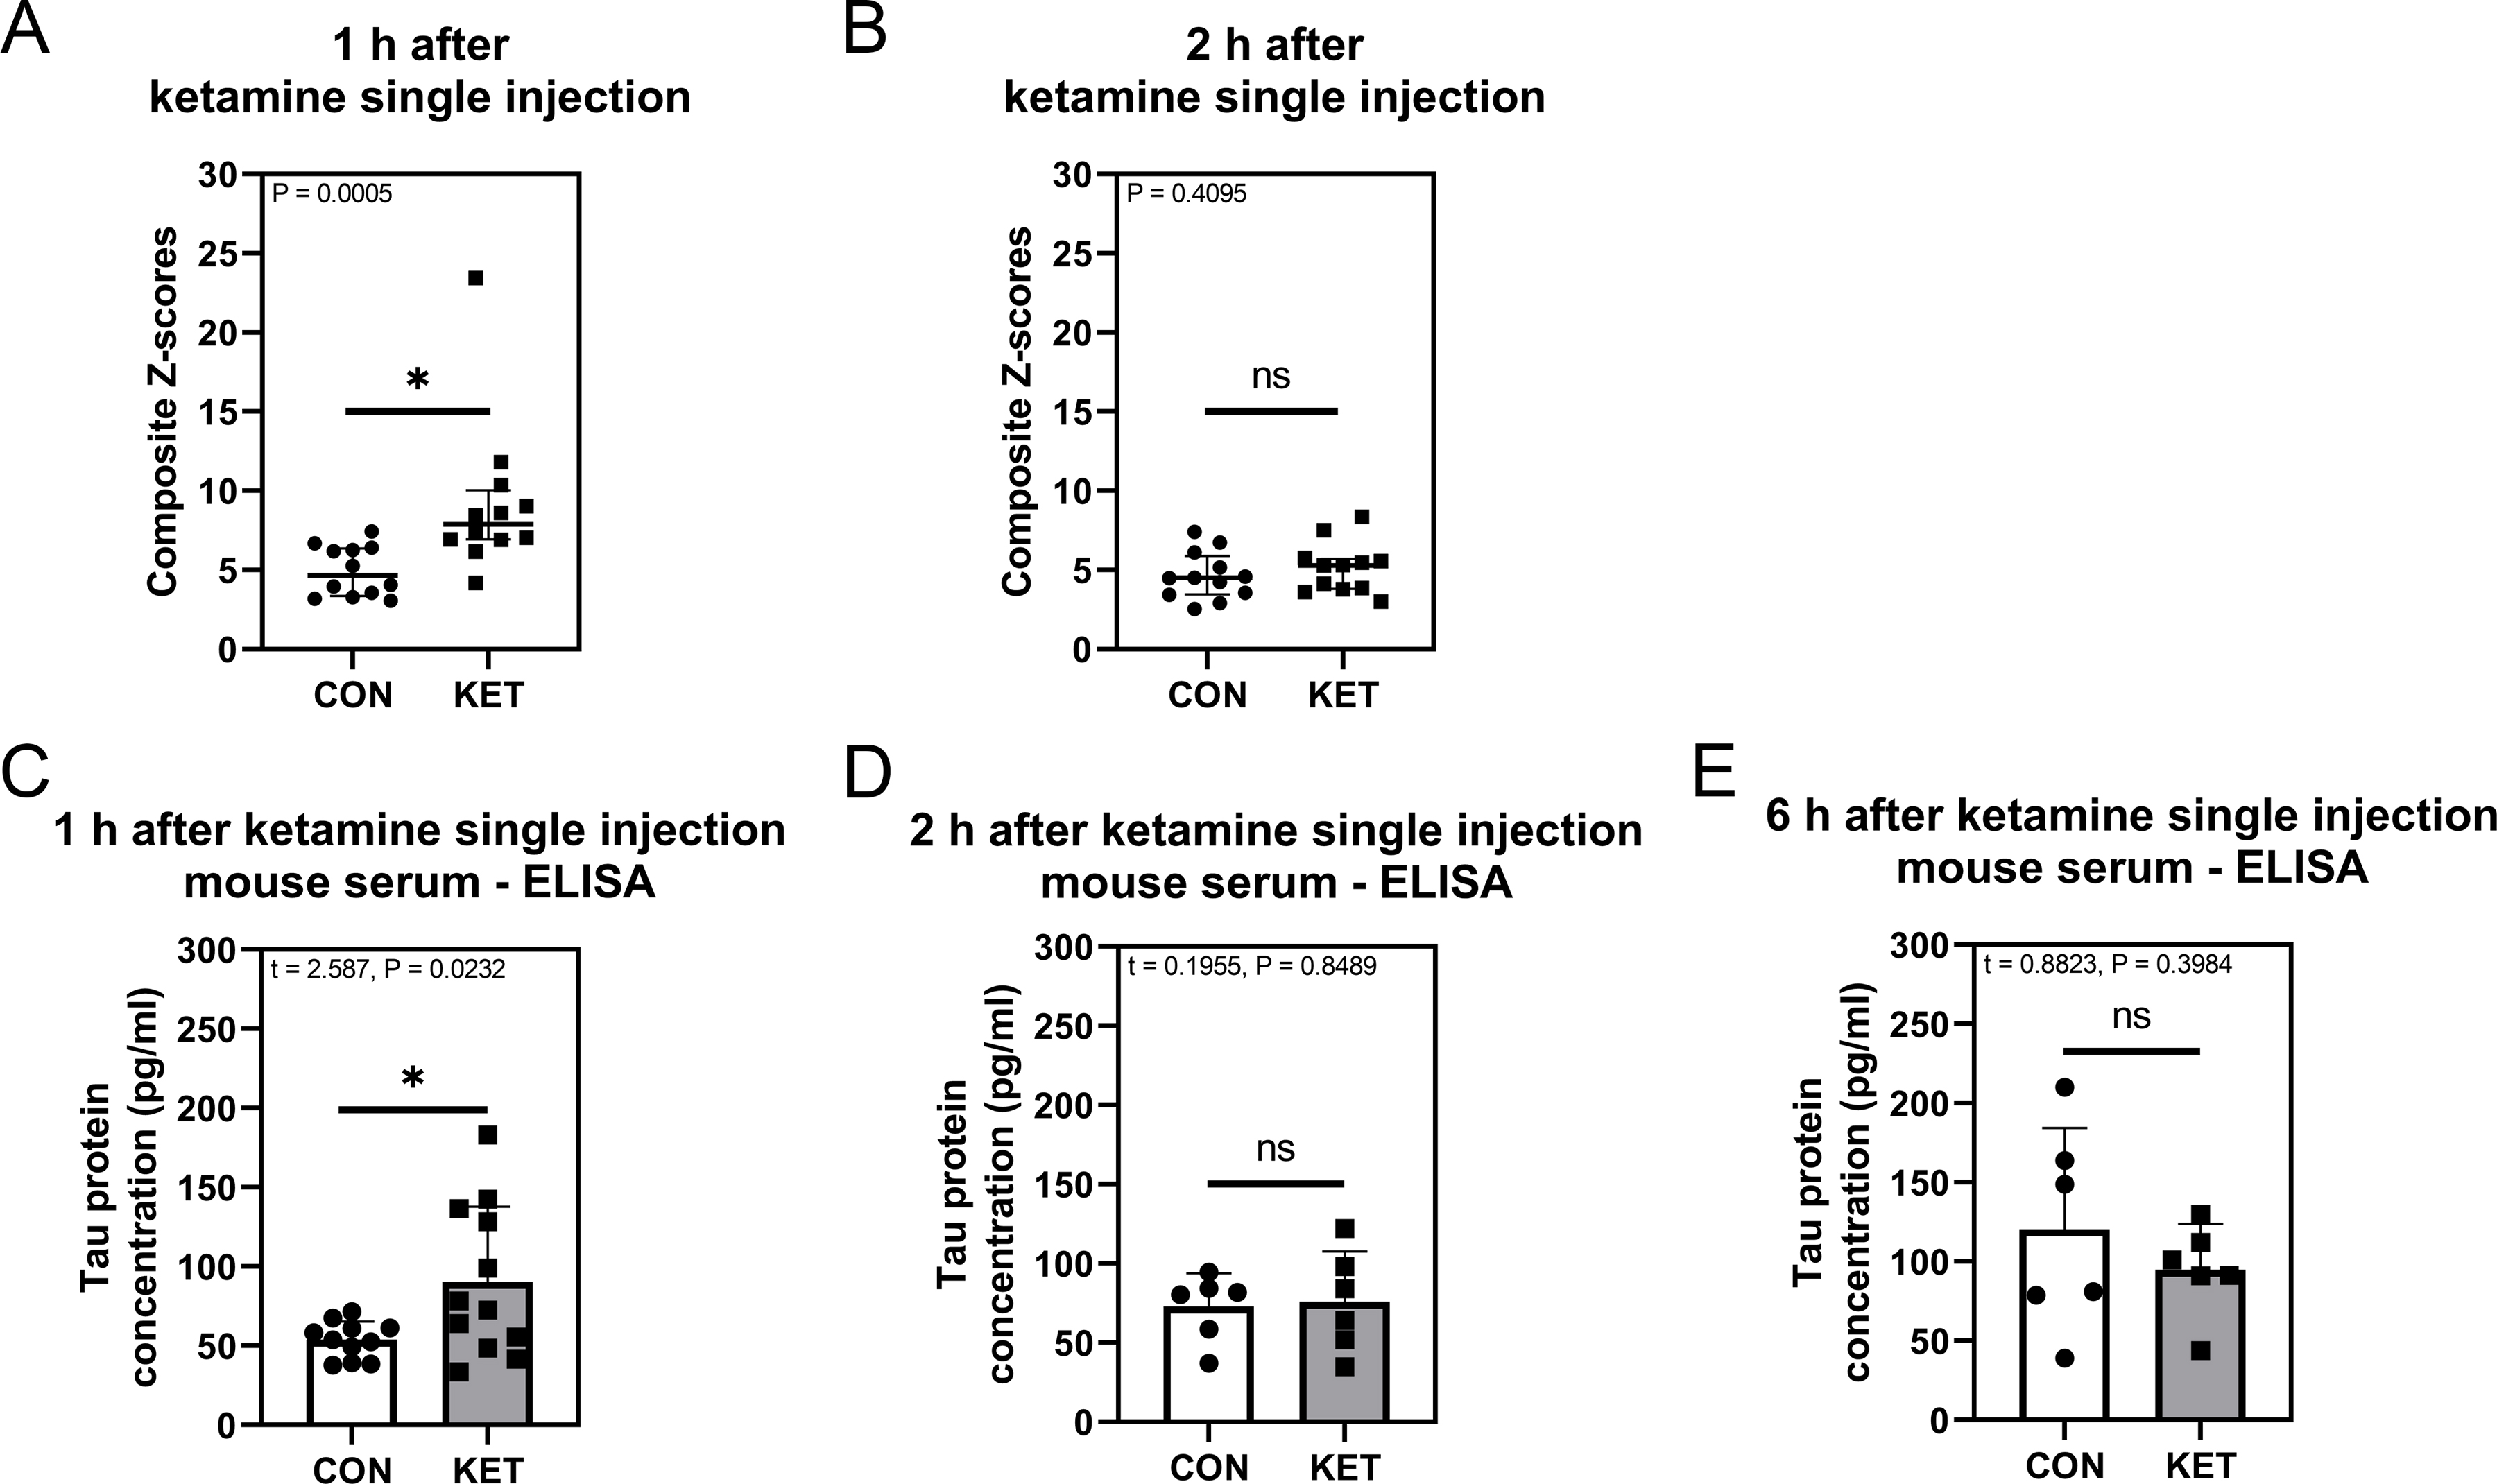
Figure 2. Ketamine induces delirium-like behavior and increases serum total tau amounts in mice.

A: Composite Z-scores 1 h after ketamine administration, n = 12 in each group. B: Composite Z-scores 2 h after ketamine administration, n = 12 in each group. C: Serum total tau protein concentration 1 h after ketamine administration, n = 11 in CON group, n = 12 in KET group. D: Serum total tau protein concentration 2 h after ketamine administration, n = 6 in each group. E: Serum total tau protein concentration 6 h after ketamine administration, n = 6 in each group. Mann-Whitney test was applied to analyze data in panels A and B. Grubbs’ test was applied to identify an outlier owing to hemolysis in data in panel C. Student’s t-test was applied to analyze data in panels C, D, and E. Error bars represent 25%–75% interquartile range in panels A and B, and SD in panels C, D, and E; * indicates P < 0.05 by statistical analysis; ns indicates no significant difference between groups (P > 0.05) by statistical analysis.
