
Figure 2. Fluorescence Images at Each Stage of LECT Seeding and Expansion.
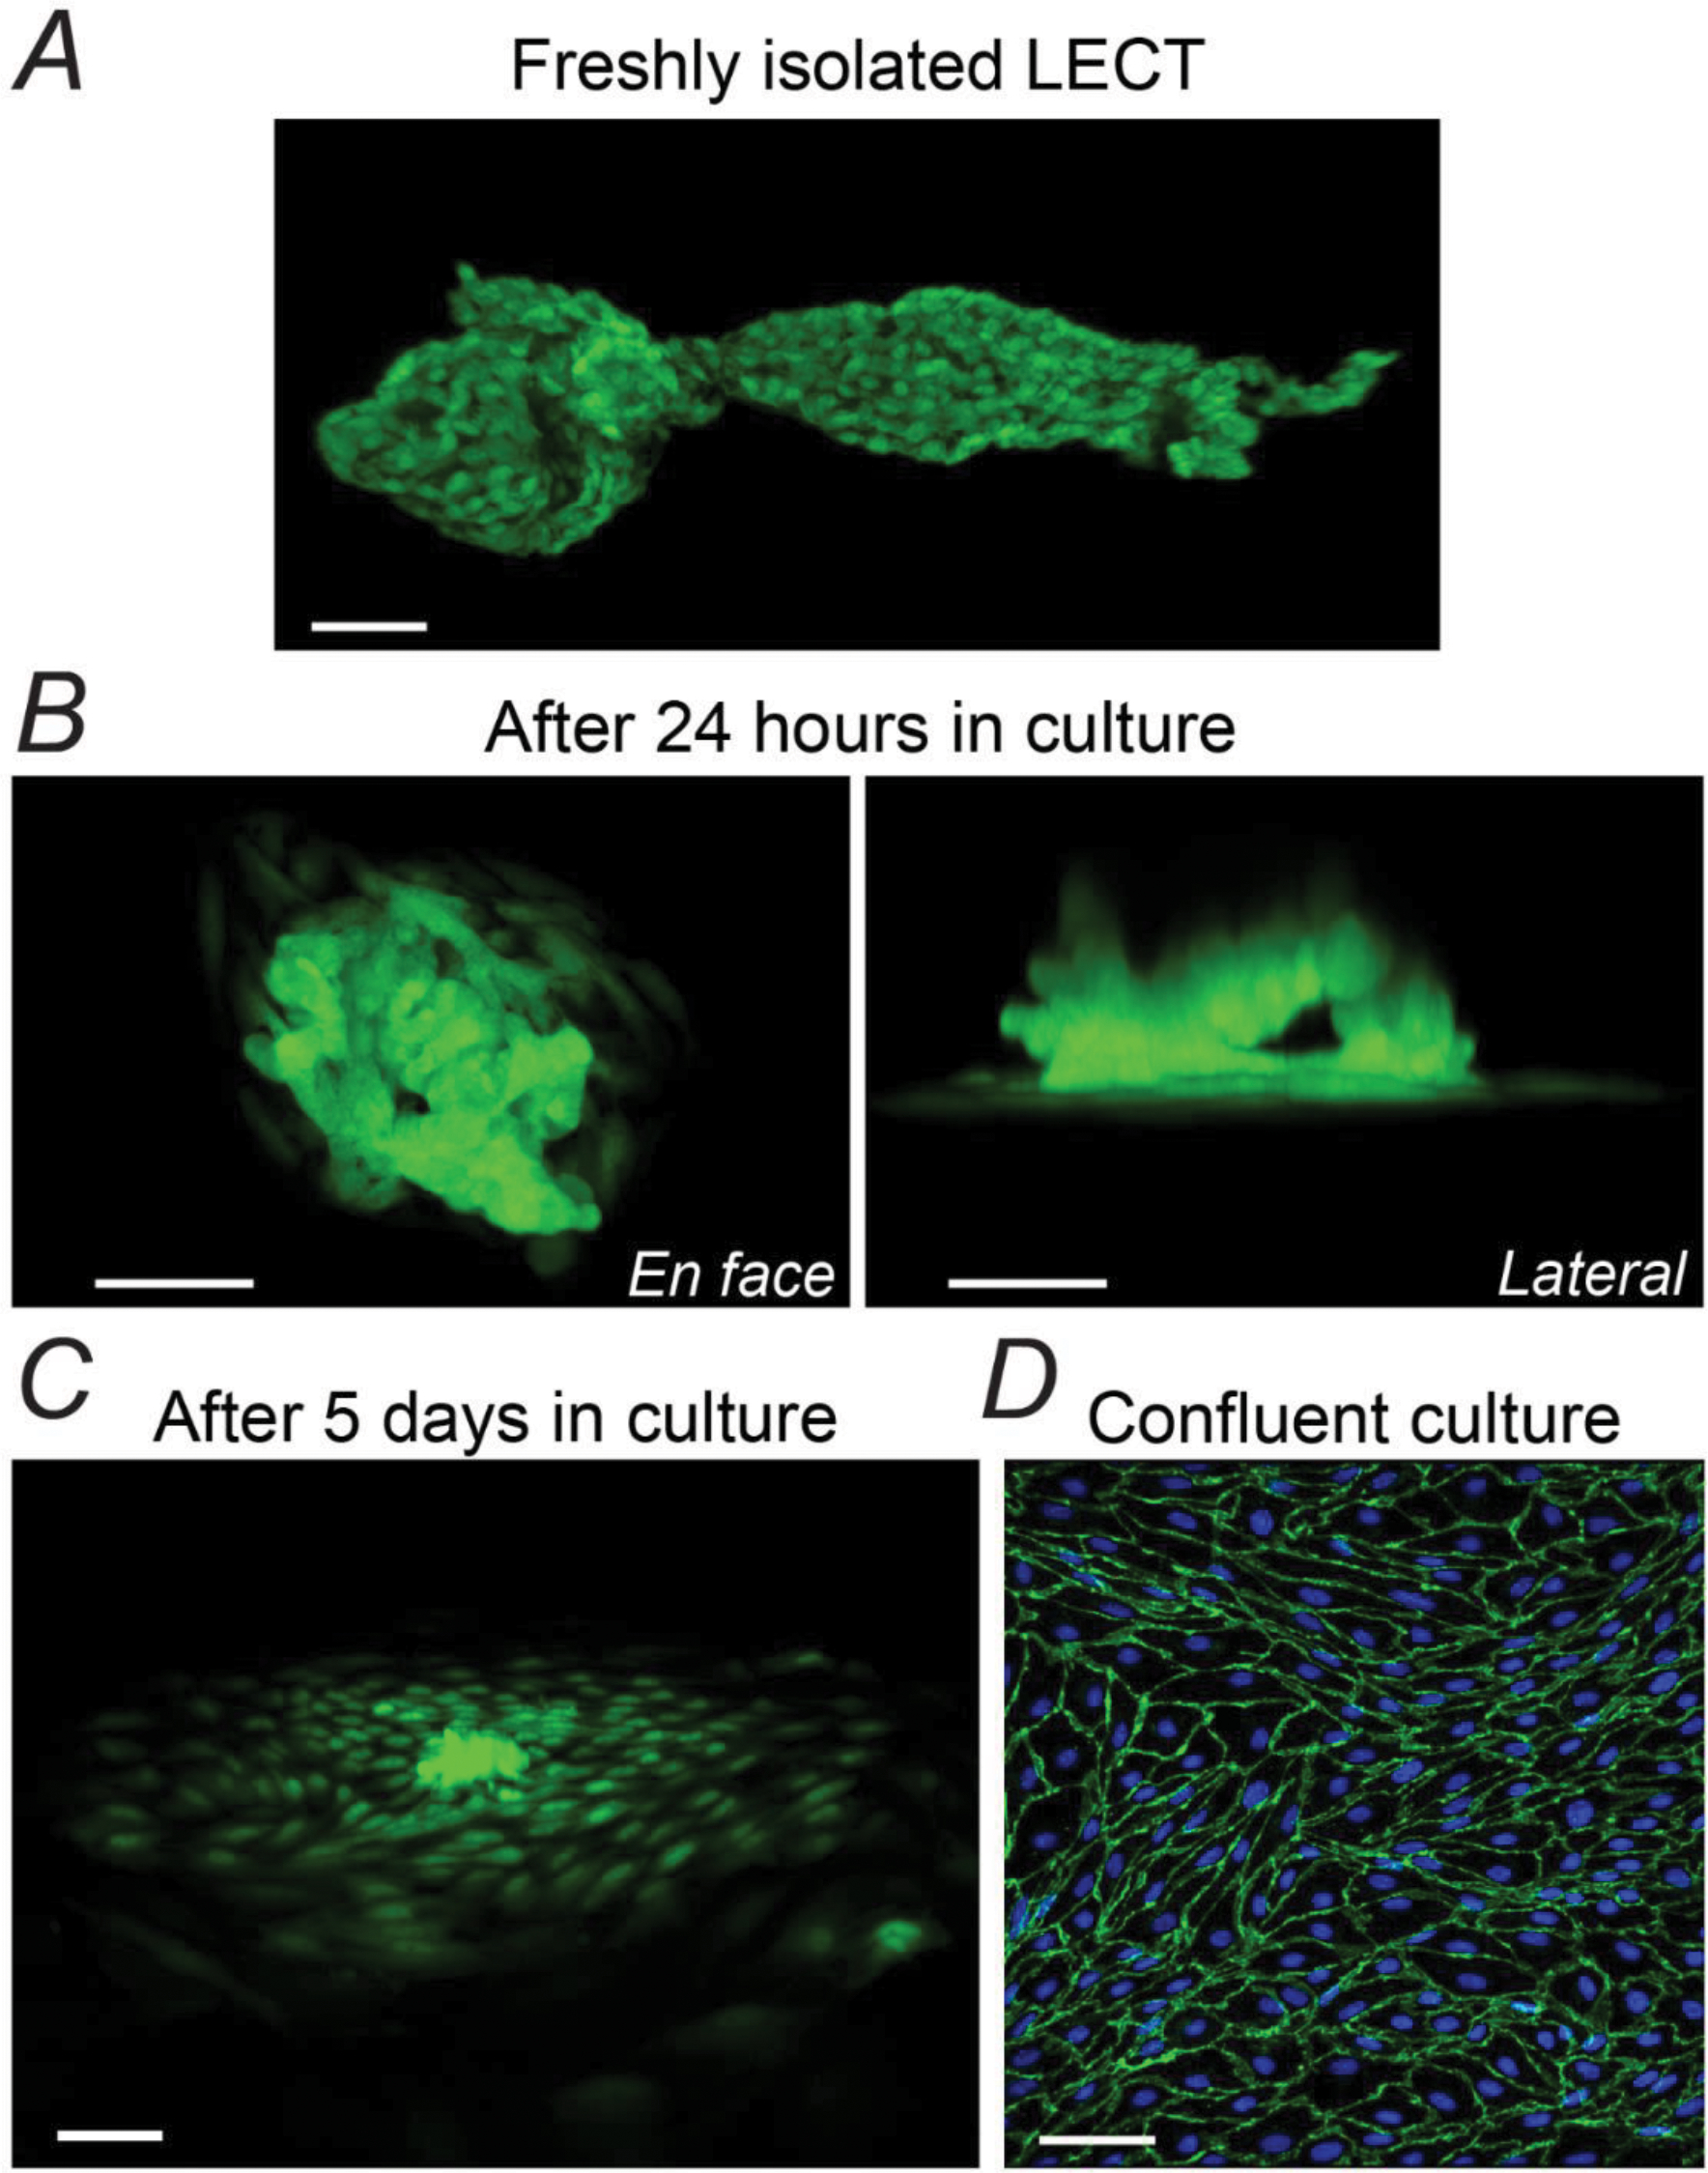
(A-C) Progressive cell attachment and proliferation beginning with an intact LECT isolated from a Prox1-GFP mouse and after 24 hours or 5 days in culture, respectively. GFP fluorescence was imaged on live cells. (D) Immunofluorescent image of a ~70–90% confluent culture of primary LECs after one passage (~6 weeks after LETC isolation and seeding). Fixed culture was co-stained for VE-Cadherin and DAPI. Scale bar equals 50 μm in all panels.