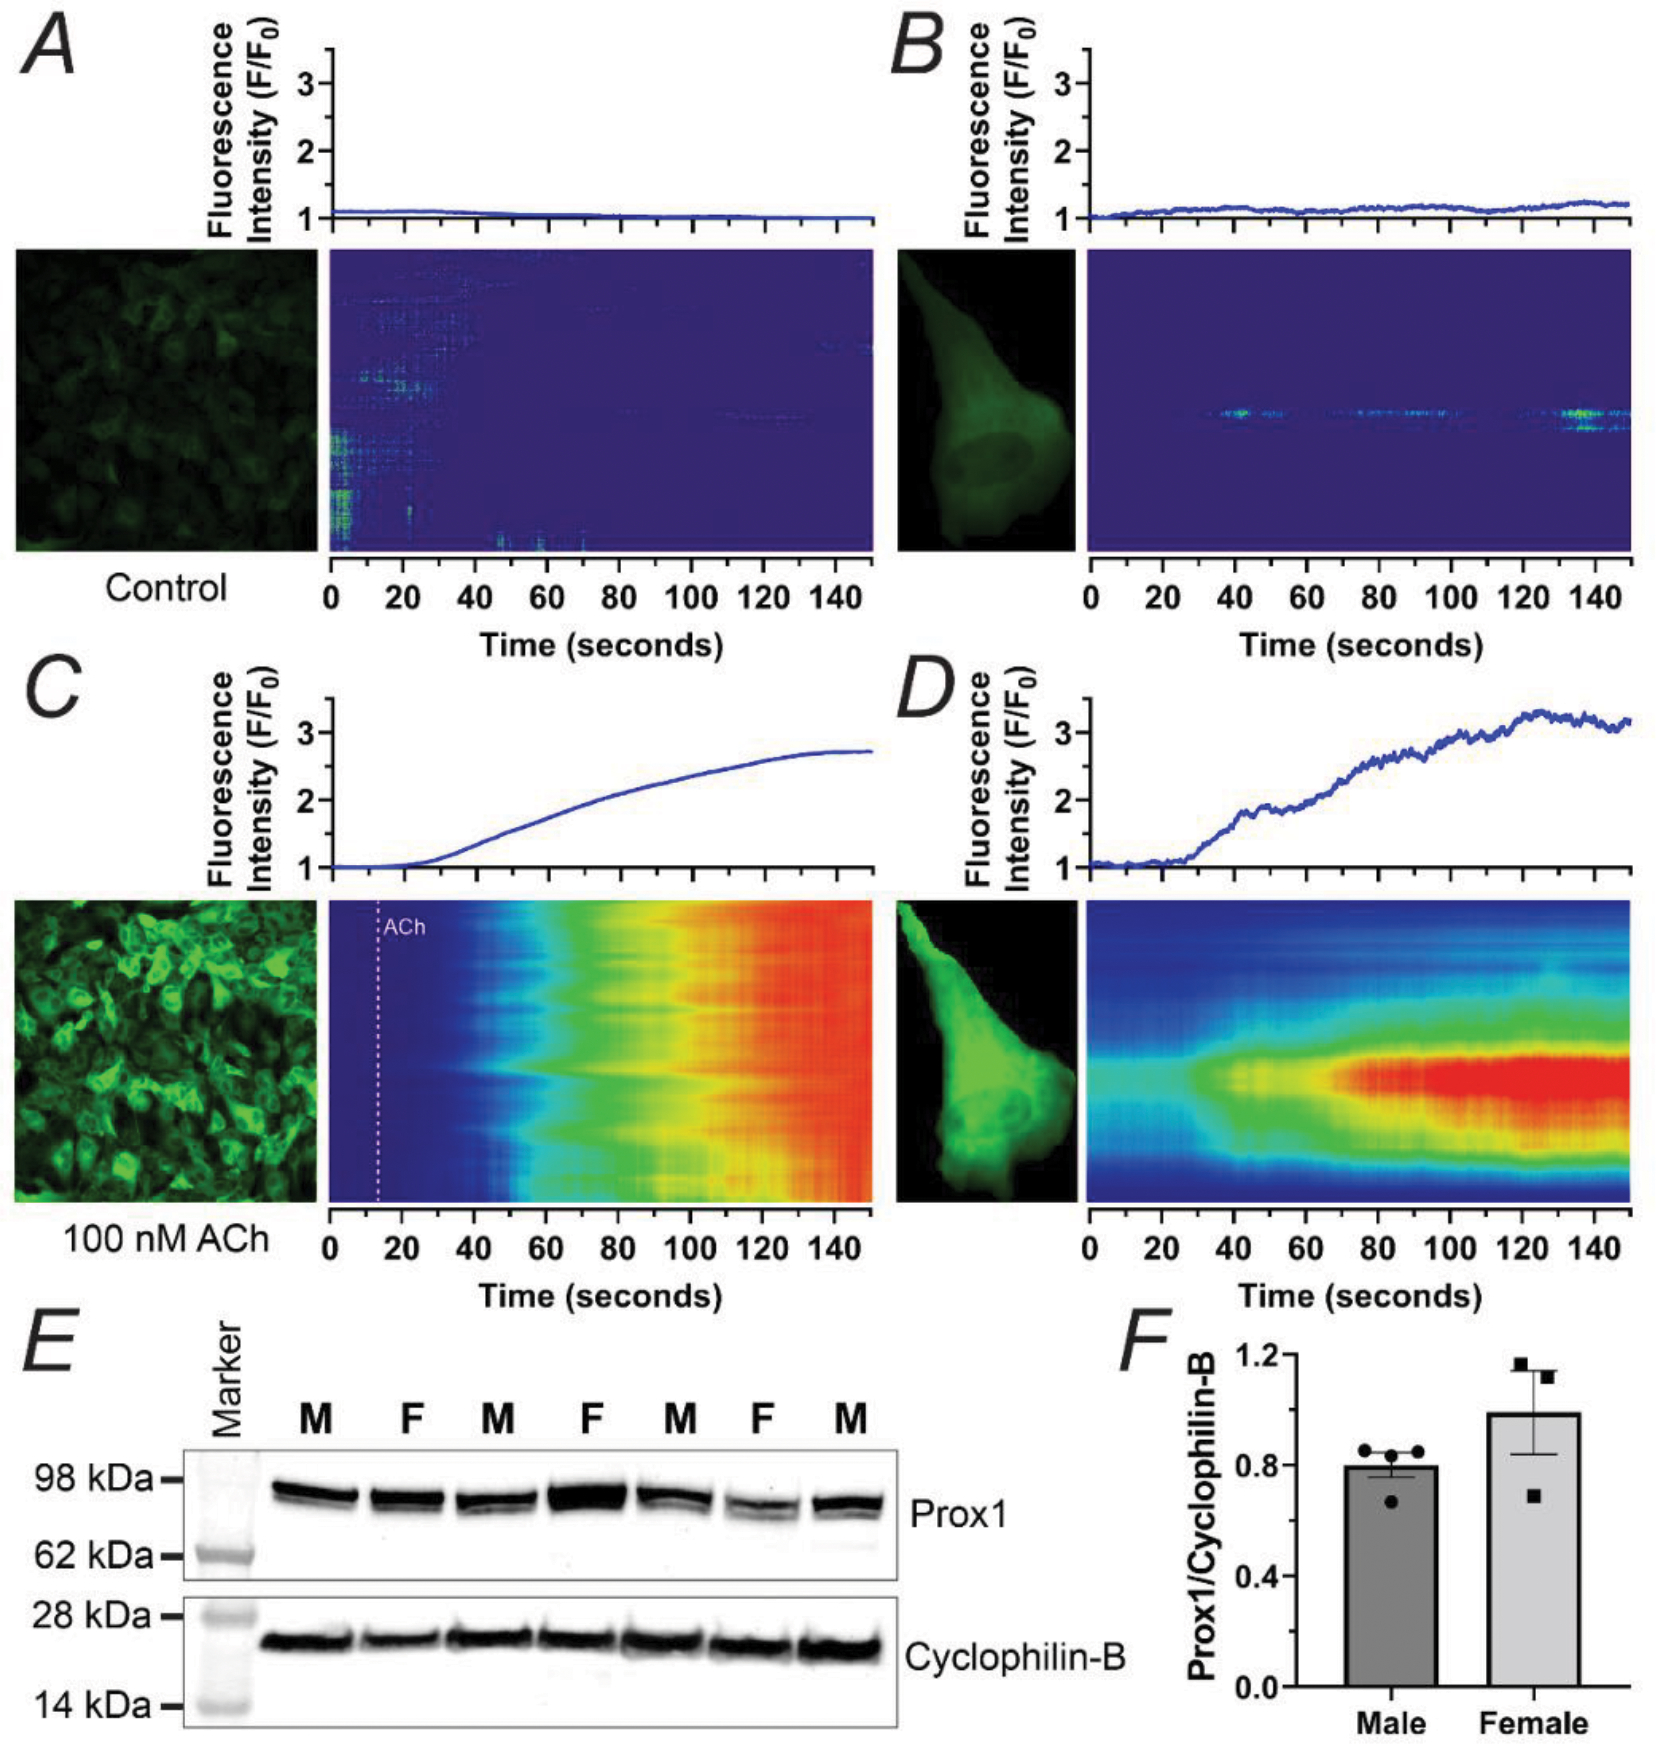
Figure 5. Proof-of-Concept Experiments Highlighting Potential Applications of Short-Term Cultures of Primary LECs from Collecting Vessels.

Intracellular calcium imaging on primary LECs from inguinal axillary collecting lymphatic vessels from a Cdh5-GCamP8 mouse under control conditions (A, B) or upon exposure to 100 nM ACh (C, D). The intensity of the fluorescence along each position on the vertical axis and over time is encoded in a colored scale where blue represents the lowest level of fluorescence intensity and red represents the highest. The integrated normalized fluorescence intensity per frame, i.e., F/F0, where F0 is the baseline fluorescence, is displayed in the blue traces on top of each of the corresponding two-dimensional maps of fluorescence intensity, i.e., space time maps (STMs). Representative data consistent with n=4 replicates. (E) Western blot showing expression of Prox1 in protein lysates prepared from primary cultures of LECs from mouse inguinal axillary collecting vessels from age-matched male (n=4) and female (n=3) mice. Male and Female samples are identified with the labels M or F respectively. Cyclophilin B was used as a loading control. (F) Summary data of Prox1 protein expression, normalized by Cyclophilin B. Data is presented as mean±SEM.
