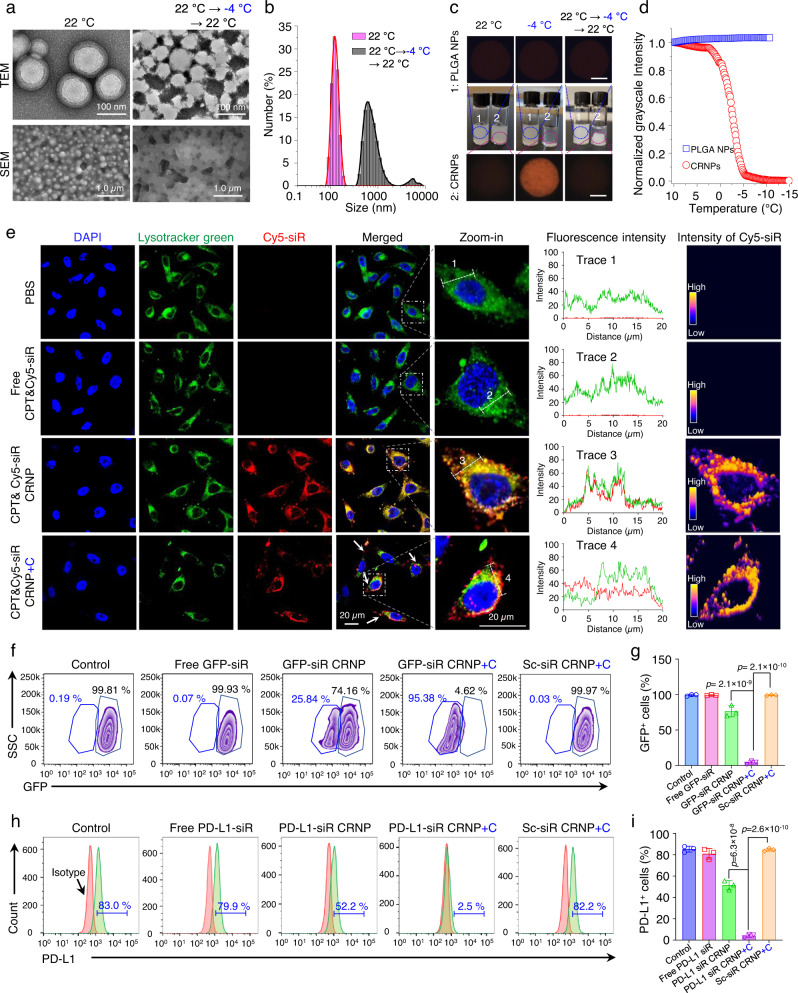
Fig. 2. Cold-responsiveness of CRNPs for enhanced endo/lysosomal escape of siRNA and gene silencing.
a Transmission electron microscopy (TEM) and scanning electron microscopy (SEM) images of CPT&siR CRNPs before and after cold treatment at −4 °C for 10 min. b Hydrodynamic size (diameter) distribution of the CPT&siR CRNPs before and after the cold treatment. c Typical photographs and cryo-microscopy images of CPT&siR PLGA NPs that are not cold-responsive and CPT&siR CRNPs at different temperatures, showing the cooling-enhanced transparency of the aqueous suspension of the CRNPs due to their disassembly at cold temperature. Scale bar: 500 µm. d Average grayscale intensity of the aqueous samples of CPT&siR PLGA NPs and CPT&siR CRNPs from their cryo-microscopy images taken at different temperatures to show the cold-responsiveness of the CPT&siR CRNPs. e Confocal images (left 5 columns), fluorescence intensity distribution (column 6), and intensity distribution of Cy5-siR (right column) of EO771 cells after incubation with PBS, free CPT&Cy5-siR, CPT&Cy5-siR CRNPs, and CPT&Cy5-siR CRNPs+C for 8 h. “+C” indicates cold treatment at −4 °C for 10 min done after the 8 h incubation. Blue: 4′,6-diamidino-2-phenylindole (DAPI bound to DNA in cell nuclei, excited at 405 nm that does not excite CPT fluorescence), red: cyanine 5 labeled siRNA (Cy5-siR), green: LysoTracker Green. f, g Expression of GFP fluorescence characterized by flow cytometry showing typical flow cytometry histograms (f) and the quantitative data (g) of GFP+ EO771 cells either with no treatment or after treated with free GFP-siR, GFP-siR CRNPs, GFP-siR CRNPs+C, and Sc-siR CRNPs+C (n = 3 independent experiments). GFP: green fluorescence protein. Sc-siR: scrambled siRNA, +C: with cold treatment at −4 °C for 10 min. h, i Expression of PD-L1 analyzed by flow cytometry showing typical flow cytometry histograms (h) and the quantitative data (i) of EO771 cells after different treatments (n = 3 independent experiments). Statistical analyses were done using one-way analysis of variance (ANOVA) with Tukey’s multiple comparisons test and correction. The experiments for a–e were repeated three times independently with similar results. Data are presented as mean ± SD (g, i). Source data are provided as a Source Data file.

