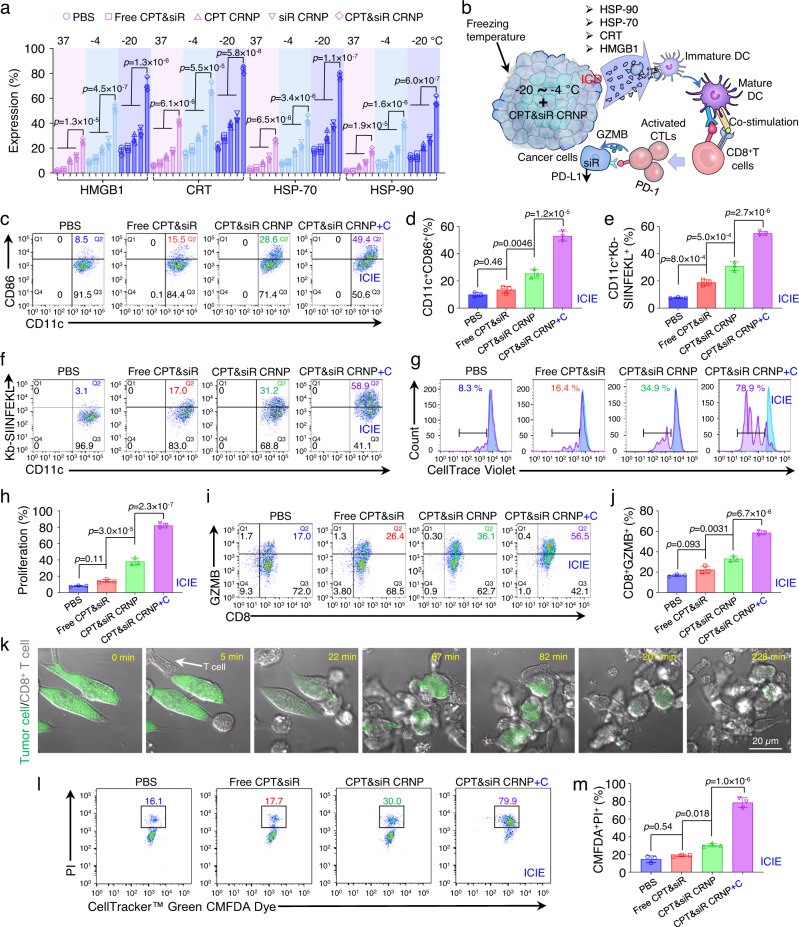
Fig. 3. Cryosurgery reinforces CPT&siR CRNPs in inducing T cell activation and tumor attacking via production of ICD.
a Expression of HMGB1, CRT, HSP-70, and HSP-90 in EO771 cells after incubating them with various formulations at −20, −4, or 37 °C for 10 min (n = 3 independent experiments). b A schematic illustration of ICD production following treatment of CPT&siR CRNPs in combination with cryosurgery to mature DCs, present the tumor-specific antigen to T cells by the matured DCs, and activate CD8+ cytotoxic T lymphocytes (CTLs) to attack cancer cells with reduced expression of PD-L1 via the release of granzyme B (GZMB). c, d Typical flow cytometry plots (c) and quantitative data (d) on maturing bone marrow dendritic cells (BMDCs) after co-culturing them with EO771-OVA cells for 24 h (n = 3 independent experiments). The EO771-OVA cells were pretreated with the indicated various formulations. “+C” represents cold treatment at −20 °C for 10 min. e, f Quantitative data (e) and typical flow cytometry plots (f) of CD11c+Kb-SIINFEKL+ BMDC percentage following co-culture with the aforementioned, pretreated EO771-OVA cells (n = 3 independent experiments). g, h Typical flow cytometry histograms (g) and quantitative data (h) of CD8+ T cell proliferation after incubating them with the BMDCs matured by the EO771-OVA cells treated with aforementioned formulations (n = 3 independent experiments). i, j Typical flow cytometry plots (i) and quantitative data (j) of activated CD8+ T cells following co-culture with the aforementioned BMDCs (n = 3 independent experiments). k Representative images showing the process of activated CD8+ T cells attacking EO771-OVA cells labeled with CellTracker™ Green CMFDA Dye. The T cells were activated by the BMDCs co-cultured with EO771-OVA cells that received CPT&siR CRNPs+C treatment. The experiment was repeated three times independently with similar results. l, m Typical flow cytometry plots (l) and quantitative data (m) of dead EO771-OVA cells after T cell attacking. T cells were activated by BMDCs cocultured with EO771-OVA cells with different formulations (n = 3 independent experiments). Statistical analyses were done using one-way ANOVA with Tukey’s multiple comparisons and correction. Data are presented as mean ± SD (a, d, e, h, j, m). Source data are provided as a Source Data file.

