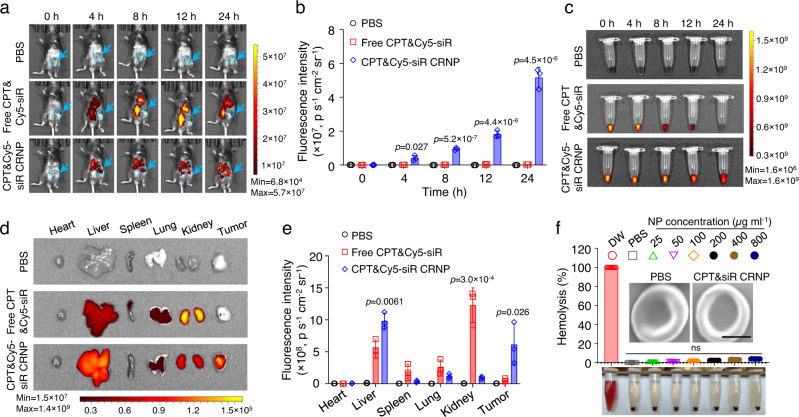
Fig. 4. CRNPs show high accumulation in orthotopic breast tumors in vivo and excellent blood compatibility.
a, b Whole animal images (a) showing the in vivo distribution of CPT&Cy5-siR CRNPs and the corresponding quantitative data (b) of the fluorescence intensity of CPT&Cy5-siR CRNPs in E0771 tumors from IVIS imaging at different time points after intravenous injection of the CRNPs (n = 3 mice). PBS and free CPT&Cy5-siR were investigated for comparison. The blue arrows and dashed circles indicate the locations of tumors. c Representative images acquired by IVIS imaging showing the Cy5 fluorescence intensity in blood drawn at various time points from mice after injection with PBS, free CPT&Cy5-siR, and CPT&Cy5-siR CRNPs (at the same Cy5-siR dose as free CPT&Cy5-siR) (n = 3 mice). d, e Typical IVIS images (d) and the corresponding quantitative data (e) showing the Cy5 fluorescence in different organs including tumors collected from mice injected via tail vein with PBS, free CPT&Cy5-siR, and CPT&Cy5-siR CRNPs and sacrificed at 24 h after the injections (n = 3 mice). f Hemolysis assay of CPT&siR CRNPs at different concentrations ranging over 25-800 µg ml−1 (n = 3 independent experiments). Deionized water (DW) and PBS were used as the positive (~100% hemolysis) and negative (~0% hemolysis) controls, respectively. Insets are the representative SEM images of red blood cells incubated with PBS and CPT&siR CRNPs at a concentration of 800 µg ml−1. Scale bar: 2 µm. ns: no significance. Statistical analyses were done using one-way ANOVA with Tukey’s multiple comparisons and correction. The experiments for c, d were repeated three times independently (n = 3 mice) with similar results. Data are presented as mean ± SD (b, e, f). Source data are provided as a Source Data file.

