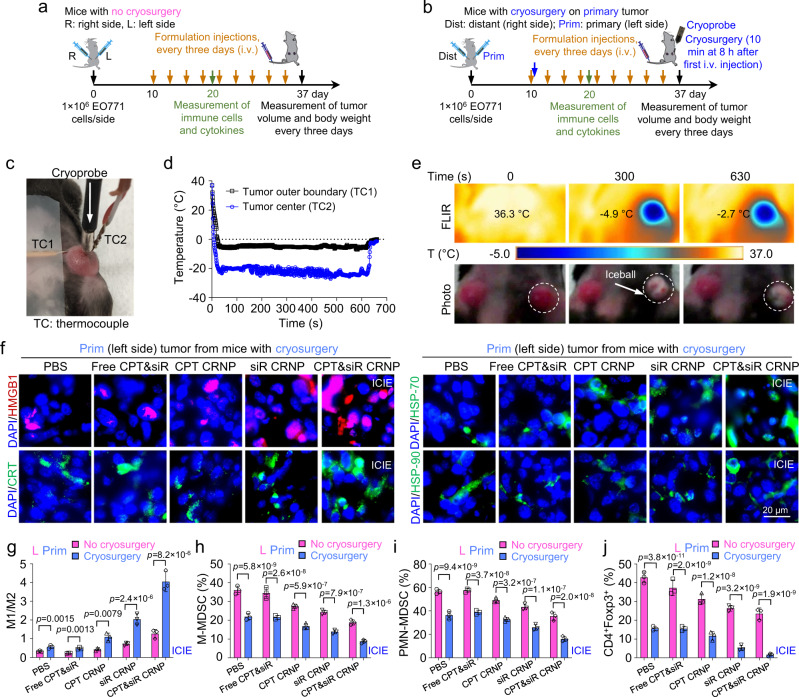
Fig. 5. ICIE turns immunologically “cold” TME into a “hot” one.
a A schematic illustration of the experimental design for mice receiving only intravenous injection of various formulations every 3 days with no cryosurgery. For these mice, the tumors on the left and right sides are indicated as L and R tumors, respectively. b A schematic illustration of the in vivo experimental design for mice receiving both intravenous injection of various formulations and cryosurgery done only on the primary (Prim) tumors on the left side. The tumors that undergo no freezing on the right side of these mice are indicated as distant (Dist) tumors. Cryosurgery was performed at 8 h after the first injection of the formulations. c A typical photograph of the tumor area of a mouse during cryosurgery. Thermocouple 1 (TC1) and TC2 are for monitoring the temperature in tumor outer boundary and center (next to the cryoprobe), respectively. d Typical thermal histories recorded at the tumor boundary and center during the cryosurgical procedure. e Representative FLIR infrared images and photographs of mice showing the tumor temperature and appearance at three different time points before (0 s), during (300 s), and after (630 s) cryosurgery. The dashed circles indicate the tumor areas. f Representative immunofluorescence images showing the expression of HMGB1, CRT, HSP-70, and HSP-90 in primary tumors treated by the indicated formulations in combination with cryosurgery. g–j Quantitative flow cytometry data on the ratio of tumor associated macrophages M1 (F4/80+CD206-CD86+) to M2 (F4/80+CD206+CD86-) (g), percentage of monocytic myeloid-derived suppressor cells (M-MDSCs, CD11b+Ly6C+Ly6G-, h), percentage of polymorphonuclear myeloid-derived suppressor cells (PMN-MDSCs, CD11b+Ly6C-Ly6G+-, i), and percentage of regulatory T (Treg) cells (CD4+Foxp3+, j) in primary (Prim) tumors of mice with both cryosurgery and injection of one of the formulations and in L (left side) tumors of mice injected with the different formations only and with no cryosurgery (n = 3 mice). Statistical analyses were done using two-way ANOVA with Sidak’s post-test and correction for multiple comparisons. The experiments for e and f were repeated three times independently (n = 3 mice) with similar results. Data are presented as mean ± SD (g–j). Source data are provided as a Source Data file.

