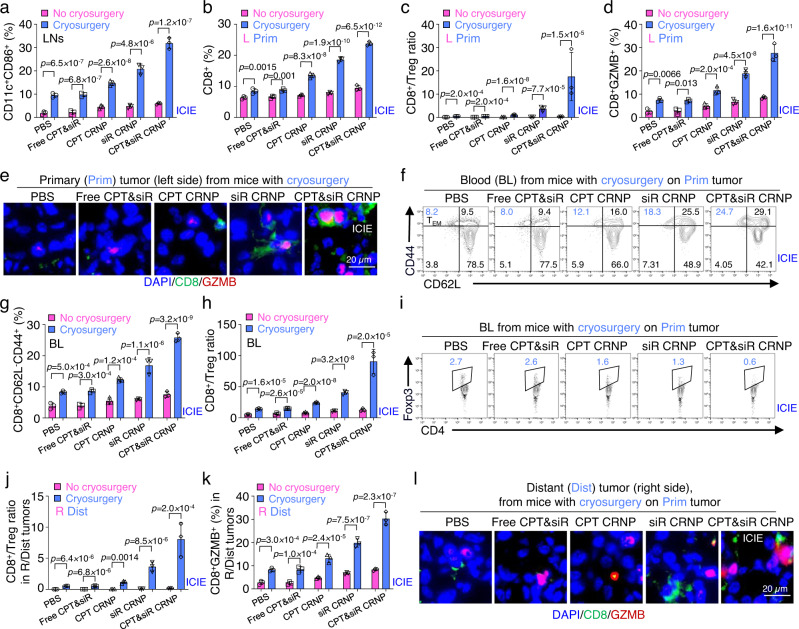
Fig. 6. ICIE stimulates antitumor immune responses in primary tumors and activates the memory immune response against distant tumors.
a–d Quantitative flow cytometry data of matured DCs (CD11c+CD86+) in inguinal lymph nodes (LNs, a), and percentage of infiltrated CD8+ T cells (b), ratios of CD8+/Treg cells (c), and percentage of cytotoxic T cells (CTLs, CD8+GZMB+, d) in primary (Prim) tumors of mice with cryosurgery and L (left side) tumors of mice with no cryosurgery (n = 3 mice). e Representative immunofluorescence images of infiltrated CTLs in primary (Prim) tumors from mice with cryosurgery (n = 3 mice). f Representative flow cytometry plots showing the percentage of effector memory T cell (TEM, CD3+CD8+CD44+CD62L−) in blood (BL) collected from mice with cryosurgery and injection of one of the various formulations. g Quantitative flow cytometry data of TEM in blood of mice with/without cryosurgery and injection of one of the different formulations (n = 3 mice). h CD8+/Treg ratios in the blood of mice with/without cryosurgery and injection of one of the different formulations (n = 3 mice). i Representative flow cytometry plots of Treg cells in blood collected from mice with cryosurgery and injection of one of the different formulations. j Quantitative flow cytometry data of CD8+/Treg ratios in distant (Dist) tumors of mice with cryosurgery and R (right side) tumors of mice without cryosurgery (n = 3 mice). All mice were injected with one of the indicated formulations. k Quantitative flow cytometry data of the percentage of infiltrated CTLs in Dist tumors of mice with cryosurgery and R (right side) tumors of mice without cryosurgery (n = 3 mice). All mice were injected with one of the indicated formulations. l Representative immunofluorescence images of infiltrated CTLs in Dist tumors from mice with cryosurgery on Prim tumors and injection of one of the different formulations (n = 3 mice). Statistical analyses were done using two-way ANOVA with Sidak’s post-test and correction for multiple comparisons. The experiments for e and I were repeated three times independently (n = 3 mice) with similar results. Data are presented as mean ± SD (a–d, g, h, j, k). Source data are provided as a Source Data file.

