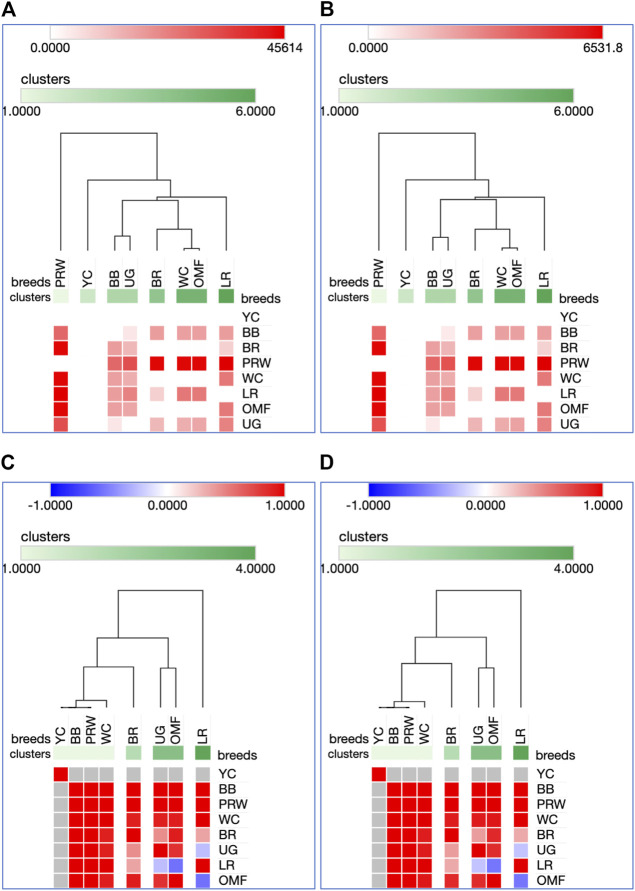
FIGURE 5.
Heatmaps and hierarchical clustering trees based on Euclidean distance metric (with the average option selected for the linkage method) and using the Type IIIa (A,C) and IIIb (B,D) data as inferred for the eight studied breeds and seven tested myogenesis associated genes expressed in the breast muscles. For constructing the trees, precomputed similarity matrices were built using Euclidean distance (A,B) and Pearson correlation (C,D) as metrics.

