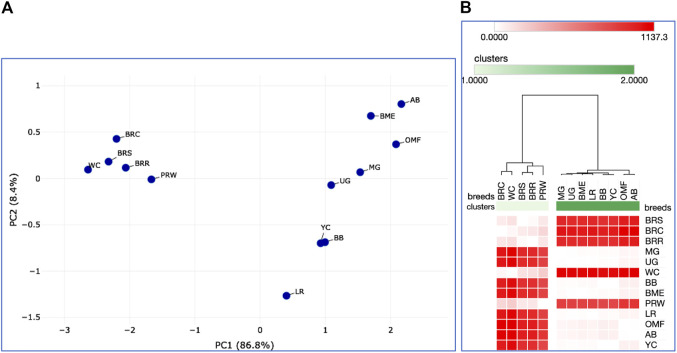
FIGURE 6.
Analysis of the distribution of 13 breeds by early growth traits, including EW and BW of chicks at three ages, as generated in the Phantasus program (Zenkova et al., 2018). (A) PCA plot. X and Y-axes show principal component 1 (PC1) and principal component 2 (PC2) that explain 86.8% and 8.4% of the total variance, respectively. N = 13 data points (breeds). (B) Heatmap and hierarchical clustering tree using Euclidean distance-based similarity matrix. For clustering, matrix values (for a precomputed distance matrix) were applied as metrics (with the average linkage method option selected).

