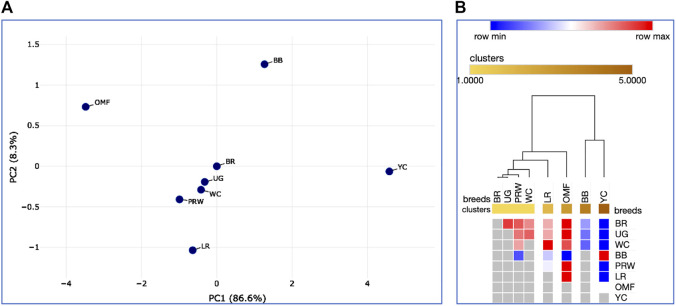
FIGURE 9.
Analysis of the distribution of the eight breeds for 21 traits (DGE of myogenesis associated genes and NO metabolism in embryos, as well as indicators of early chick growth) performed in the Phantasus program (Zenkova et al., 2018). (A) PCA plot. X and Y-axes show principal component 1 (PC1) and principal component 2 (PC2) that explain 86.6% and 8.3% of the total variance, respectively. N = 8 data points (breeds). (B) Heatmap and hierarchical clustering tree based on Euclidean distance metric (with the average option as linkage method).

