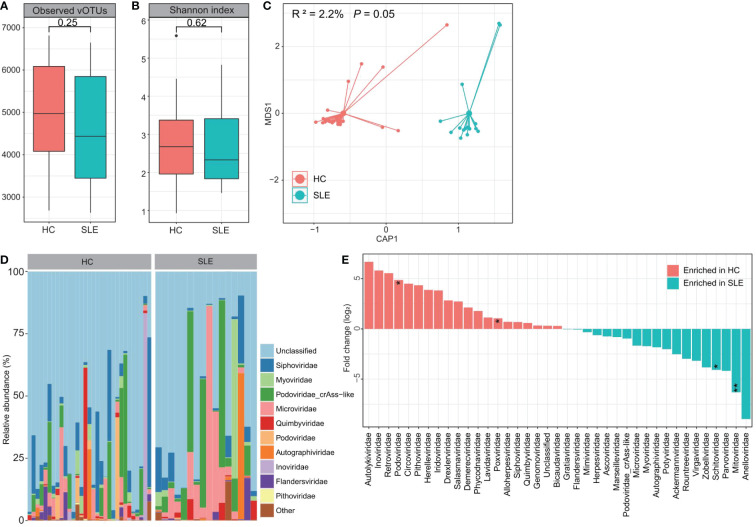
Figure 3.
Difference of VLP-based gut virome between SLE patients and healthy controls. (A, B) Boxplot showing the observed number of vOTUs (A) and Shannon diversity index (B) between two groups. The significance level is calculated using the Student’s t test. (C) dbRDA analysis based on the gut viral composition at the vOTU level reveals the separations between SLE patients and healthy controls. The location of samples (represented by filled nodes) in the first two multidimensional scales are shown. Lines connect samples that belonged to the same group. (D) Composition of VLP-based gut virome at the family level. (E) Barplot showing the fold changes of viral families when compared between patients and controls. The significance level in the Wilcoxon rank-sum test is denoted as: * adjusted P < 0.05, ** adjusted P < 0.01.

