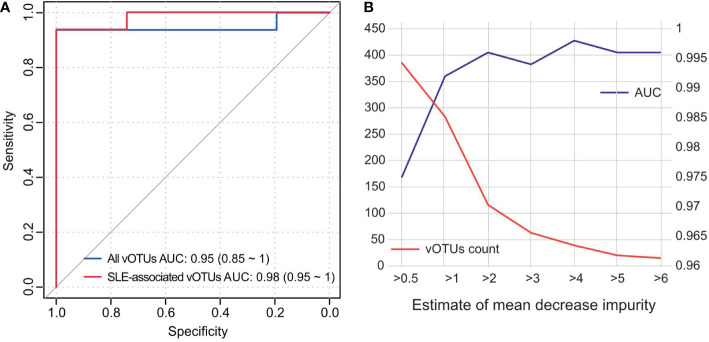
Figure 5.
Classification of SLE status by the abundance of gut virome. (A) ROC analysis for the classification of SLE patients and healthy controls. The performances of models trained and tested by all vOTUs and 426 SLE-associated vOTUs are shown. (B) AUC values for different numbers of vOTUs used in the random forest models. The number of vOTUs is shown by the red line on the left axis, and the AUCs are shown by the blue line on the right axis.

